The Pod Is Lying to You
CrashLoopBackOff is not an error state, --previous is not how you debug one, and the pod that has no shell can still be debugged. The chapter that makes you self-sufficient.
The pod says CrashLoopBackOff. You do what everyone does — you search for it, and the top answer tells you, with total confidence, to run kubectl logs <pod> --previous. You run it:
unable to retrieve container logs for containerd://5839ae...Nothing. So now you have a crashing pod and a debugging command that does not work — and the internet has no further suggestions. Meanwhile the fix was sitting one flag away, in the command you did not try because a blog post talked you out of it: plain kubectl logs crasher prints the crash message immediately.
That is this chapter. Not a tour of monitoring stacks — the tools that ship with kubectl, used the way they actually behave rather than the way the folklore says they do. By the end you should be able to walk up to any broken pod and get to the cause without opening a browser tab.
Describe first. Always.
The first move on any misbehaving object, before logs, before anything:
kubectl describe pod crasherkubectl get shows you a row. kubectl describe shows you the story: the image and its pull status, the resolved environment, the volumes, the current and previous container states, the exit code, every condition, and — at the bottom, where people stop scrolling — the Events. More Kubernetes problems are solved by scrolling to the bottom of a describe than by any other single action, because the events are where the machine explains itself in prose.
A pod stuck Pending will tell you why in an event, verbatim, in a sentence a human wrote: no node has enough CPU, a PVC is unbound, a taint is not tolerated. A pod that will not pull its image says ImagePullBackOff in the status and, in the event, why. A pod that starts and dies says how it died. None of that is in kubectl get pods, and all of it is one command away.
Two smaller reflexes belong in the same breath. kubectl get pod -o wide adds the pod’s IP and — more usefully — the node it landed on, which is the first thing you want the moment a failure is suspiciously specific to one machine. And the Conditions block in a describe is a five-line summary of the pod’s whole life: PodScheduled tells you the scheduler placed it, Initialized that the init containers finished, ContainersReady and Ready that the probes are passing. Reading down that list tells you how far the pod got before things went wrong, and every debugging path below is really just a branch on that answer.
CrashLoopBackOff is not an error. It is a wait.
Let’s break something on purpose. Run the catalog with a DATABASE_URL that isn’t a URL, so the process prints a fatal error and exits 1 within a second of starting. Watch the pod:
READY   STATUS             RESTARTS
0/1     Error              4
0/1     Error              4
0/1     CrashLoopBackOff   4
Same pod, seconds apart, two different STATUS values. This oscillation confuses everyone the first time — and it is the key to the whole thing. The two words mean genuinely different things:
Error— the container ran, died, and has not been restarted yet. This is the state right after a crash.CrashLoopBackOff— the kubelet is deliberately waiting before trying again.
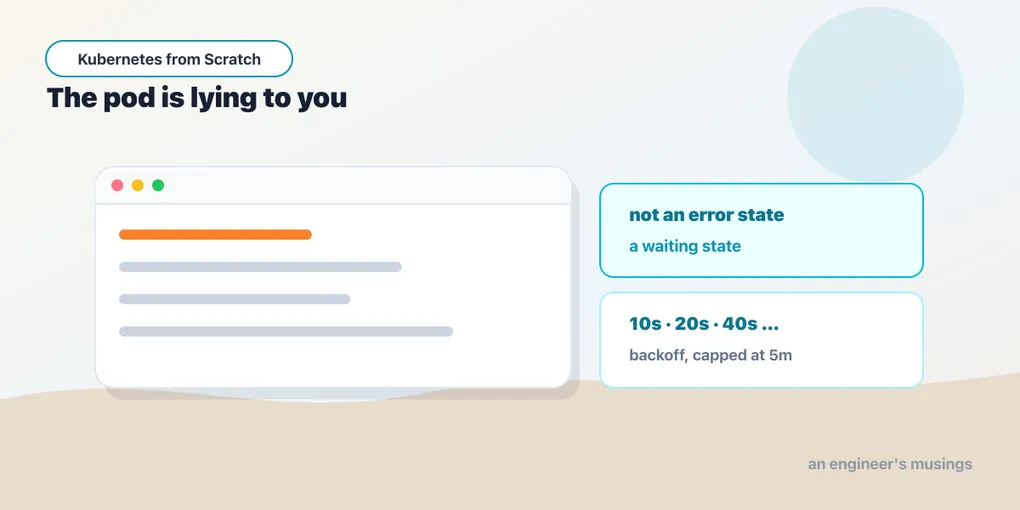
CrashLoopBackOff is not a failure mode. It is not an error the kubelet is reporting. It is a waiting state, and the thing it is waiting on is a timer that the kubelet set on purpose. Your container has crashed repeatedly, so the kubelet is backing off — the delay grows with each failure and then plateaus.
I left a crashlooping pod running and timed it, because a number like “capped at five minutes” is exactly the sort of unstated default that quietly changes between releases:
restart 4 -> 5:   ~90s
restart 5 -> 6:  ~180s
restart 6 -> 7:  ~262s
restart 7 -> 8:  ~323s
restart 8 -> 9:  ~303s
restart 9 -> 10: ~303s
Read it top to bottom. The doubling is right there — 90, 180 — and then it stops, and the last three intervals sit flat around 300 seconds. That is the cap, and it is five minutes. (I sampled every twenty seconds, so read these as “about 300”, not as three significant figures. The point is the shape: geometric growth, then a ceiling.)
This explains the behavior that makes people think the cluster has frozen: the restart count stops moving. Look at the samples above — RESTARTS sat at 4 across all three. That is not the kubelet giving up. It is the kubelet waiting out a backoff that is now minutes long, and it will restart the container the moment the timer expires. There is no give-up: sit and watch a mature crashloop and you will see a restart roughly every five minutes, for the rest of the cluster’s life or until you fix it.
The events say it plainly. After three minutes of this:
Normal   Started  16s (x6 over 3m9s)  kubelet  Container started
Warning  BackOff  15s (x6 over 3m8s)  kubelet  Back-off restarting failed container crasher
Read the counters, because they are the whole diagnosis compressed into eight characters. x6 over 3m9s means: this event has fired six times, the first of them 3 minutes and 9 seconds ago, the most recent 16 seconds ago. Six starts and six back-offs in three minutes, alternating. That is a container that starts, dies, and gets rescheduled by a timer — not a container that failed once and was abandoned. Kubernetes deduplicates repeated events into one line with a count, which is why an event log of a crashlooping pod is four lines rather than four hundred, and why the count is the most informative number on the screen.
The reason for the backoff is worth stating, because it is the same reason your retry loops have one. A container that crashes instantly, restarted instantly, is a hot loop: it burns a CPU, hammers whatever it was failing to connect to, and floods the API server with events. The backoff turns a pathological failure into a slow, cheap, observable one. It is the kubelet protecting your cluster from your bug.
The logs advice everybody repeats is wrong
Now, the logs. Here is what actually happened on that crashlooper — both commands, run back to back:
$ kubectl logs crasher
catalog: FATAL: DATABASE_URL is malformed

$ kubectl logs crasher --previous
unable to retrieve container logs for containerd://5839ae...
Plain kubectl logs worked and printed the exact cause. --previous failed.
That is the reverse of the advice you have read a hundred times, so understand the mechanism rather than swapping one piece of folklore for another.
kubectl logs returns the logs of the container in the pod’s current container slot — and on a crashlooper, that container is dead. It died two seconds ago. Its log output is still on disk on the node, and the kubelet will happily serve it to you. Which is exactly what you want: the most recent dead container’s output is the crash you are trying to debug.
kubectl logs --previous asks for the log of the container before the current one — a different container ID, an earlier incarnation. On a fast crashloop, that container has often already been garbage-collected by the runtime. containerd reaped it, the log file went with it, and the API server can only tell you it cannot retrieve what no longer exists. The command is not broken — it is asking for a thing that has been deleted.
So the rule, corrected:
- Reach for plain
kubectl logsfirst on a crashlooper. It is the most recent death, which is the one you want. --previousis for a container that has restarted into a healthy one. The pod isRunning,1/1, and you want to know why the last instance died — a liveness probe killed it, it OOMed, it segfaulted. The current container’s logs are useless to you and--previousis the only way back. That is its job.--previouscan come back empty even then, once the runtime has garbage-collected the old container. It is best-effort against a log file somebody else may already have deleted, which is a good reason to ship logs off the node.
That last point is the argument for log aggregation compressed into one sentence. Container logs live on the node’s disk, they are rotated, and they are deleted with the container — kubectl logs is a debugging convenience, not a log store. Anything you need to be able to read tomorrow has to be shipped somewhere else today.
While we are here, the flags that earn their keep: -f to follow, --tail=50 to stop a 40,000-line dump, -c <container> when the pod has more than one (without it, a multi-container pod makes you pick), --since=10m to bound the window, and -l app=web --prefix to read every pod behind a label at once with the pod name in front of each line. I did not exercise those flags in the crashloop lab — they are the CLI’s own, not results I ran — but they are the difference between reading logs and drowning in them.
The exit code is not in the logs
The logs told us what the process said. They cannot tell us how it died, because a process that gets killed by the kernel does not get to write a farewell. The exit code lives in the pod’s status:
$ kubectl get pod crasher -o jsonpath='{.status.containerStatuses[0].lastState.terminated}'
{"containerID":"containerd://62eae48bd663efadfe0e8534c942a0088409138052154b0b61d04a594c8014e2","exitCode":1,"finishedAt":"2026-07-14T02:40:28Z","reason":"Error","startedAt":"2026-07-14T02:40:28Z"}
lastState.terminated is the forensic record of the previous incarnation — reason, exit code, container ID, start time, finish time — and it is the field to read when you want to know how the container ended rather than what it printed. Note startedAt and finishedAt are the same second: this container lived for less than a second, which is its own diagnosis.
Ask for the two fields you actually want and it reads like a verdict:
$ kubectl get pod crasher -o jsonpath='reason={.status.containerStatuses[0].lastState.terminated.reason}  exitCode={.status.containerStatuses[0].lastState.terminated.exitCode}'
reason=Error  exitCode=1
describe shows you the same thing in prose, under Last State.
Two readings cover most of what you will see:
reason=Error,exitCode=1— the process ran, decided things were bad, and exited on its own. This is a your application failure: a config it could not parse, a dependency it could not reach at startup, a panic. The logs will have the reason, because the process wrote it before exiting. That is our crasher.reason=OOMKilled,exitCode=137— the process did not decide anything. The kernel killed it for exceeding its memory limit, with no chance to log a word. 137 is 128+9, signal 9, SIGKILL. If you go hunting in the logs for why an OOMKilled container died, you will find nothing, because there is nothing to find — the answer is in the status field and the fix is in theresources.limits.memorywe set in the scheduling chapter. An OOMKill with an empty log is not a mystery; it is the expected shape of an OOMKill.
That distinction — the process exited versus the process was executed — is the first fork in every debugging session, and it costs one jsonpath to resolve.
kubectl debug: a shell in a pod that has no shell
Here is a problem the tools above cannot touch. Your image is distroless. It has one binary and no shell, no ps, no curl, no cat — which is a genuinely good idea for a production image, since an attacker who gets code execution finds no tools waiting for them. It is also why kubectl exec -it pod -- sh returns exec: "sh": executable file not found, and why you are now considering rebuilding the image with busybox in it just to look around, which will change the thing you are trying to debug.
Ephemeral containers solve this. kubectl debug injects a new container, with an image of your choosing, into a running pod:
$ kubectl debug <web-pod> --image=bookshop:v1 --target=web -- ps aux
PID   USER     TIME  COMMAND
    1 shop      0:00 /usr/local/bin/web
   38 shop      0:00 ps aux
Look carefully at what that output proves. PID 1 is /usr/local/bin/web — the target container’s process, not anything belonging to the debug container. --target=web joined the debug container to web’s PID namespace, so from inside my throwaway container I am looking at the target’s process tree as if I were inside it. PID 38 is my own ps. I brought my own tooling to a container that had none, without touching the image and without a shell existing anywhere in it.
Two facts about this that matter operationally, and both were checked:
The pod is not restarted. Restart count before: 1. Restart count after: 1. The ephemeral container is added to a running pod and the existing containers are not disturbed — which is the entire point, because a restart would destroy the state you are trying to inspect. The classic tragedy of debugging a container is that the act of getting inside it wipes the evidence. This does not.
The ephemeral container cannot be removed. It is appended to .spec.ephemeralContainers, and there is no kubectl undebug:
$ kubectl get pod <web-pod> -o jsonpath='{.spec.ephemeralContainers[*].name}'
debugger-m7jjq
That entry is on the pod until the pod dies. You cannot delete it, and the pod’s spec is now permanently a little bigger than the Deployment that created it. In practice this is fine — the pod is ephemeral itself, and the next rollout replaces it — but it means kubectl debug is not free of side effects, and a pod you have debugged four times has four dead ephemeral containers hanging off its spec. Debug the pod, get your answer, and let the pod be replaced.
Two variants worth knowing, which I did not run and am flagging as such. kubectl debug node/<node-name> -it --image=… gives you a container on a node, with the host filesystem mounted at /host — for when the problem is the node and not the pod. And kubectl debug <pod> --copy-to=<new-name> --set-image=… makes a copy of the pod with something changed — a different image, an overridden command — which is how you debug a pod whose container crashes so fast you cannot attach to it: copy it, override the command to sleep 3600, and poke at the resulting container at your leisure.
Events, and the hour you have to read them
Events are the most under-used surface in Kubernetes. They are the running commentary of every controller in the cluster — the scheduler explaining why it could not place a pod, the kubelet explaining a failed probe, the ReplicaSet controller explaining a rejected create. Sorted by time, they read as a narrative:
kubectl get events --sort-by=.lastTimestampType that with the --sort-by. Without it, events come back in essentially arbitrary order — which is the single reason most people conclude events are useless and stop looking. Narrow it to one object with --field-selector involvedObject.name=crasher when the namespace is noisy.
And now the thing that catches people, badly, at exactly the wrong moment: events expire. They are objects in etcd with a TTL, and the API server’s default is one hour. The event that explained why your pod was evicted at 3am is not there at 9am. It is gone — there is nothing to grep, no --since that will bring it back, and no amount of kubectl describe will resurrect it. (The lab ran on the default; I did not change or test the retention setting.)
Which reframes what events are. They are not a log — they are a live diagnostic surface with a short memory. If a class of failure matters to you across time, something has to be watching events and shipping them somewhere durable, and that is a real thing you install rather than a thing the cluster does for you. Until you have that, treat a broken pod’s events as evidence that is actively decaying while you decide whether to look at it. Look now.
One more surface, mentioned because you will reach for it and it will fail: kubectl top pod and kubectl top node report live CPU and memory usage — and they require metrics-server, which is a separate deployment that kind does not ship. On the lab cluster, kubectl top returns an error, not numbers. That is not a broken cluster; it is a component you have not installed. Most managed clusters install it for you, which is why the command works in your cloud and not on your laptop.
The decision tree
Everything above, arranged as the order to try things in.
Pod is Pending. It has not been scheduled. Nothing has run, so there are no logs to read and kubectl logs will tell you as much. Go straight to kubectl describe pod and read the FailedScheduling event — it names the reason for every node it rejected: insufficient cpu, insufficient memory, untolerated taint, unbound PVC. The message is specific — believe it.
Pod is CrashLoopBackOff or Error. The container ran and died. kubectl logs <pod> — not --previous — for what the process said on its way out. Then lastState.terminated for how it died: exitCode=1 means the app quit on purpose and the logs will explain, OOMKilled/137 means the kernel killed it and the logs will not, because it never got the chance.
Pod is Running but 0/1 Ready. The container is alive and the readiness probe says no. kubectl describe will show you the failing probe and its message. Remember what the health chapter established: a failed readiness probe does not remove the pod’s address from the EndpointSlice — the address stays and its ready condition flips to False. So check the EndpointSlice conditions, not the address list, and do not conclude the endpoint “disappeared” when it did not.
Requests fail with a connection refused, or curl returns 000. The pod is fine and the routing is broken. This is the Service chapter’s failure: check that the Service’s selector actually matches the pod’s labels, because a one-character typo produces a Service with zero endpoints and no error message anywhere. kubectl get endpointslices and look for an empty one. Kubernetes will never tell you that a selector matches nothing — it is a valid, working Service that happens to select the empty set.
Everything looks fine and it still doesn’t work. kubectl get events --sort-by=.lastTimestamp, and read the last twenty minutes of the cluster’s own account of itself. Then kubectl debug your way into the pod’s network namespace and try the request from where the application would make it, because “it works from my laptop” and “it works from inside the cluster” are different claims and only one of them is the one that matters.
Final thoughts
The thread running through all of this is that Kubernetes is not hiding anything from you — it is telling you the truth in fields you have not learned to read. CrashLoopBackOff is not a cryptic failure, it is a timer. x6 over 3m9s is not clutter, it is the diagnosis. exitCode=137 is not a mystery, it is the kernel’s signature on a memory limit you set. The gap between an engineer who is comfortable debugging a cluster and one who is not has almost nothing to do with knowing more commands, and almost everything to do with reading the output of the four they already have.
And be suspicious of confident advice, including this chapter’s. --previous is the standard answer to CrashLoopBackOff, repeated in a thousand places, and on a fast crashloop it failed on a real cluster while the command it displaced worked on the first try. That was not a fluke of my setup — it is what happens whenever the runtime reaps the container before you get there. The cluster is the source of truth about the cluster. Run the command, read what it actually said, and trust that over the thing you remember reading.
Next: A CRD With No Controller Is a Database Row With Good Manners
Comments