Pending Forever: What the Scheduler Is Really Telling You
Requests place a pod, limits kill it, and a taint will never attract one — the asymmetries that decide where your workload runs.
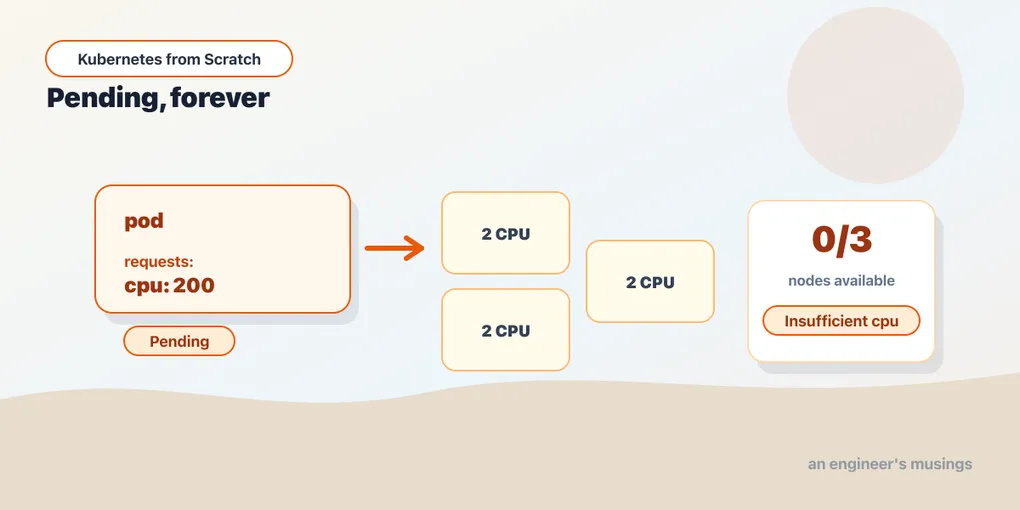
A pod has been Pending for eleven minutes. Not CrashLoopBackOff, not ImagePullBackOff, not Error — Pending, with a clean 0/1 and a restart count of zero. Nothing in the cluster is red. The Deployment is not failed. No alert fired. The scheduler is not stuck, has not crashed, and is not confused; it has looked at your pod several hundred times by now, decided there is nowhere to put it, and gone back to sleep. It will do that again in a moment, and every moment after that, for as long as the pod exists.
Pending is not an error state. That is the first thing to understand about scheduling — failure to schedule is not a failure. It is a steady state, indefinitely maintained, that the system considers entirely reasonable. Your pod will sit there until something about the cluster changes, and if nothing changes, it will sit there forever, quietly, with no complaint louder than an event.
Which is a shame, because that event is the single most informative sentence Kubernetes will ever print at you. Let us earn it.
Two numbers that do completely different jobs
Every container can declare two things about a resource:
resources:
  requests:
    cpu: 20m
    memory: 32Mi
  limits:
    memory: 128Mi
That is straight from the bookshop’s catalog Deployment, and the asymmetry in it — a memory limit, no CPU limit — is deliberate. To see why, you need to know that these two fields are not “minimum” and “maximum” of the same thing. They are read by two entirely different pieces of software, at two entirely different times, and one of them never even looks at the other.
requests is what the scheduler reserves. It is the only input the scheduler uses to decide whether a pod fits on a node. Not the container’s actual usage. Not last week’s metrics. Not the limit. The scheduler walks the nodes, sums the requests of every pod already assigned to each one, subtracts that from the node’s allocatable capacity, and asks whether your request fits in what is left. It is a bin-packing problem over declared numbers, and the declared numbers are all it knows.
This has an immediate and slightly startling consequence: the scheduler does not care what your pods are actually doing. A node running twenty pods that each requested 500m of CPU is, as far as the scheduler is concerned, completely full — even if every one of those pods is idle and the node’s real CPU utilization is two percent. Conversely, a node whose pods requested nothing at all looks completely empty even while it is melting. Requests are a promise, and the scheduler treats them as facts.
limits is what the kernel enforces. The kubelet takes your limits and writes them into the container’s cgroup, and from that moment on Kubernetes is out of the loop. The Linux kernel enforces the ceiling — at runtime, on every scheduling quantum, without asking anyone. Nothing about a limit affects where your pod lands. Set a memory limit of 4Gi on a container that requests 32Mi and the scheduler will happily put it on a node with 100Mi free, because the request is the only number it read.
State the units once and never wonder again. CPU is measured in cores, and m means millicores — 1000m is one full core, 20m is two percent of one core. It is an amount of time, not a share of anything. Memory is in bytes with the usual suffixes, and note that Mi is 2^20 while M is 10^6 — they are different numbers, and the manifests in this book use Mi throughout.
The asymmetry that is the whole chapter
CPU and memory are not two instances of the same idea. They behave differently at the limit, and the difference is not a detail:
CPU is compressible. If a container hits its CPU limit, the kernel simply gives it less CPU. The container is throttled — it runs, but slowly, its threads parked at the end of each 100ms accounting period until the next one begins. Nothing dies. Nothing restarts. Your p99 latency goes through the roof, your request queue grows, and every dashboard you own turns yellow, but the process is alive and it will still be alive tomorrow. A CPU limit is a speed limit.
Memory is not compressible. You cannot give a process “less memory” than it has already allocated. There is no throttling a byte. So when a container crosses its memory limit, the kernel has exactly one lever — and it pulls it. It kills the process.
That asymmetry drives a real and widely-held recommendation, which is why the bookshop’s containers set a memory limit and no CPU limit. Always set memory requests and memory limits, and set them equal or close. Memory is the resource that gets you killed, so bound it. Set CPU requests, and think hard before setting CPU limits, because a CPU limit does not protect the node — CPU is already shared fairly by weight, in proportion to requests, whenever the node is busy — it only slows your own container down, sometimes badly, sometimes at exactly the moment it most needs to catch up. There are good reasons to set CPU limits (predictable performance in a benchmark, a hard billing boundary, a noisy neighbour you do not trust), and there is a long history of teams setting them by reflex and then spending a quarter chasing latency spikes that were their own cgroup quota all along.
QoS is something you are assigned, not something you choose
Every pod gets a QoS class. You will find it in status.qosClass. You cannot set it — it is derived from the requests and limits you wrote. Three pods, three shapes, run on the lab cluster:
| what the container declared | resulting qosClass |
|---|---|
| requests equal limits, for CPU and memory | Guaranteed |
| requests set, limits partial or absent | Burstable |
| nothing set at all | BestEffort |
That is the whole algorithm — no configuration, no override, no annotation to force it. Guaranteed requires that every container in the pod sets both a request and a limit for both resources, and that the request equals the limit in each case. Miss one — set a memory limit but no CPU limit, as the bookshop does — and you are Burstable. Set nothing, as kubectl run does by default, and you are BestEffort.
The class matters when a node runs out of memory as a whole, not because one container exceeded its own limit but because the sum of everything on the box exceeded the machine. Then the kubelet starts evicting pods to save the node, and it evicts in QoS order: BestEffort first, Burstable next (worst offenders relative to requests first), Guaranteed last. So the pod that declared nothing is the pod that dies first, which is a nicely poetic form of justice — you told the scheduler you needed nothing, and the cluster believed you.
I did not force node-level memory pressure in the lab, so read the eviction ordering as the documented policy rather than as something I watched happen. The QoS derivation itself I did run: three pods, three classes, exactly as in the table.
Pending forever, and the best error message in Kubernetes
The lab cluster is three kind nodes — one control plane, two workers — with 2 CPU each. So ask for a hundred times more than exists:
resources:
  requests:
    cpu: "200"
The pod is greedy, and here it is:
greedy 0/1 Pending 0 12sAnd here, verbatim, is the FailedScheduling event:
0/3 nodes are available: 1 node(s) had untolerated taint(s), 2 Insufficient cpu.
no new claims to deallocate, preemption: 0/3 nodes are available:
3 Preemption is not helpful for scheduling.
Learn to read this sentence and you have learned to debug half of all scheduling problems, because it is not a complaint — it is a census. The scheduler considered every node in the cluster, and it is telling you what happened to each one. Watch the arithmetic:
0/3 nodes are available— three nodes exist, none of them will take this pod.1 node(s) had untolerated taint(s)— that is the control plane. Every kind cluster (and every managed cluster, and every kubeadm cluster) taints its control-plane node withnode-role.kubernetes.io/control-plane:NoScheduleout of the box, precisely so your workloads do not land on the machine running etcd. That node was never a candidate and never will be, for any ordinary pod.2 Insufficient cpu— the two workers. They would take the pod; they simply do not have 200 cores.
1 + 2 = 3. The numbers add up to the cluster. They always add up to the cluster, and that is what makes the message so useful: every node is accounted for by exactly one reason. When a real pod is Pending in a real cluster, you get a line like 0/47 nodes are available: 12 Insufficient memory, 30 node(s) didn't match Pod's node affinity/selector, 5 node(s) had untolerated taint(s), and you now know how to read it — 30 nodes were the wrong shape, 5 were reserved for something else, and 12 were the right shape but full. That tells you whether to fix the pod or grow the cluster, which is the actual question.
Then the second half. preemption: 0/3 nodes are available: 3 Preemption is not helpful for scheduling. Kubernetes has priority classes: give a pod a higher priorityClassName and, when it cannot be scheduled, the scheduler will consider evicting lower-priority pods to make room. Here it considered it and concluded that killing things would not help — because even an empty node has 2 CPUs, and no amount of evicting produces 200. Read that line whenever a high priority pod is Pending: “preemption is not helpful” means “there is nothing I can kill that would fix this”, which is a much stronger statement than “the node is full”. (Priority and preemption were not exercised in the lab beyond this message; treat the mechanism as described, not demonstrated.) And no new claims to deallocate is about Dynamic Resource Allocation — the mechanism for GPUs and other devices in modern Kubernetes — telling you there were no device claims it could free either.
One more time, because the shape of it is the lesson: this pod is not failed. kubectl get pod greedy will report Pending next week. The scheduler is retrying — cheerfully, on a backoff — and the day someone adds a 256-core node to the cluster it will schedule and run. Nothing times out. If you want a Pending pod to become an alert, you have to build that yourself, because Kubernetes does not consider it a problem.
A real OOMKill, and the trick to earning one
Now the other side of the asymmetry. Give a container a 128Mi memory limit, and then ask the bookshop app to allocate 200MB via the endpoint that exists for exactly this purpose. The app listens on :8080 inside its own pod, so the request has to be made from in there — kubectl exec puts you in the container, where localhost is the container’s own loopback:
kubectl exec -n lab hungry -- curl -s "http://localhost:8080/debug/eat?mb=200"The pod is hungry:
hungry 1/1 Running 1 (12s ago)Running, and 1 restart. The container’s lastState tells you what happened to the one that died:
reason=OOMKilled exitCode=137137 is 128 + 9. The convention is that a process killed by signal n exits with 128 + n, and signal 9 is SIGKILL. So the exit code is telling you, in the oldest dialect in Unix, that this process did not exit — it was shot.
And the shooter is not Kubernetes. When a container exceeds its cgroup memory limit, the kernel’s OOM killer fires. There is no negotiation, no SIGTERM first, no terminationGracePeriodSeconds, no preStop hook, no chance to flush a buffer or finish an in-flight request or close a database connection. The process is running one instruction and then it is not running at all. Every graceful-shutdown mechanism Kubernetes offers you — and there are several, and the chapter on Deployments leaned on one of them — is irrelevant here, because the kernel is not a Kubernetes component and does not know they exist.
What Kubernetes does do is notice the corpse. The kubelet sees the container exit, records OOMKilled with exit code 137 in lastState, and — because the pod’s restartPolicy is Always by default — starts it again. The pod survives. The container restarts in place. The pod name does not change and no new pod is created. So an OOMKill looks, from the outside, like a mysterious restart count that goes up. If your only view of a service is “is the pod Running”, you will never see it. If a container’s restart count is climbing and nobody knows why, kubectl describe pod and read Last State — the word OOMKilled will be sitting right there.
There is one nuance in that experiment worth more than it looks. The app does not merely allocate 200MB — it walks the allocation and writes a byte into every page:
hog = append(hog, make([]byte, mb<<20))
for i := range hog[len(hog)-1] {
    hog[len(hog)-1][i] = 1 // touch every page, or the kernel never commits it
}
If it only allocated, there would be no OOM kill at all. Linux hands out virtual address space eagerly and physical pages lazily: a page you have never written does not consume memory, because it is not backed by anything yet. The cgroup accounting counts resident pages, not promised ones. So a naive OOM demo — allocate a huge array, watch it get killed — will frequently just not get killed, and you will conclude that limits do not work. They work. You have to touch the memory. This is also, incidentally, why “our app’s RSS is way below what we allocated” is a normal and unalarming observation, and why memory limits are so much harder to size than people expect: the number that matters is the one the app touches, and no configuration file tells you what that is.
Do not confuse an OOMKill with an eviction. OOMKilled: one container crossed its own limit, the kernel killed it, the kubelet restarted it, the pod stayed. Evicted: the node ran out of memory, the kubelet picked victims by QoS class, and the pod was deleted and rescheduled elsewhere — a different mechanism, a different symptom, a different fix. They both start with “out of memory” and they mean opposite things about whose fault it is.
Taints, tolerations, and the misconception that costs an afternoon
Requests decide whether a pod fits. Taints decide whether a node wants it.
A taint is a property of a node that repels pods — a toleration is a property of a pod that lets it ignore a specific taint. Taint a worker:
kubectl taint node k8s-lab-worker2 tier=premium:NoScheduleand then scale a Deployment whose pods have no toleration to four replicas. Every one of them lands on the other worker:
4 k8s-lab-workerZero on worker2. The node is still healthy, still has capacity, still shows up in kubectl get nodes as Ready — it is simply refusing this pod, and the scheduler respects that without complaint. (If a Pending pod’s FailedScheduling message says node(s) had untolerated taint(s), this is what it means, and it is why the control plane never gets your workloads.)
Now add the toleration to a pod:
tolerations:
  - key: tier
    operator: Equal
    value: premium
    effect: NoSchedule
Here is the thing that everyone learns the hard way, and that I ran to be certain of: the pod does not go to worker2. A toleration does not attract. It only removes the repulsion. The tolerating pod is now allowed on the tainted node — and it is still allowed on every other node too, and the scheduler will spread it wherever it likes, which is usually somewhere else entirely. To actually pin the pod to that node, the toleration is not enough; it took a nodeSelector as well:
tolerations:
  - key: tier
    operator: Equal
    value: premium
    effect: NoSchedule
nodeSelector:
  kubernetes.io/hostname: k8s-lab-worker2
With both, the pod ran on k8s-lab-worker2. With only the toleration, it did not.
Taints repel; they do not attract. Say it out loud once, because the “GPU node” story bites everyone: you taint the expensive GPU nodes so that ordinary workloads stay off them, you add a toleration to your training job so it is allowed onto them, and then your training job schedules onto a cheap CPU node and runs at one-thirtieth the speed while the GPUs sit idle. The toleration was necessary. It was never sufficient. You needed a nodeSelector (or node affinity) on the GPU label to say where the pod wants to be, and the taint to say where everyone else cannot. They are two halves of one pattern and neither works alone.
Three taint effects exist. NoSchedule — the one above — refuses new pods and leaves running ones alone. PreferNoSchedule is a soft version: the scheduler will avoid the node if it can, and use it if it must. NoExecute is the aggressive one: it refuses new pods and evicts pods already running there that do not tolerate it, optionally after a tolerationSeconds grace period. Kubernetes uses NoExecute itself — when a node goes unreachable, the node controller taints it node.kubernetes.io/unreachable:NoExecute, and the reason your pods do not evaporate the instant a node’s network hiccups is that an admission plugin quietly adds a 300-second toleration for that taint to every pod you create. That five-minute pause between “node went away” and “pods rescheduled” is not a timeout somewhere — it is a default toleration on your own pod spec. Only NoSchedule was exercised in the lab; the other two effects and the built-in node-condition taints are described here, not demonstrated.
Saying where a pod wants to be
The nodeSelector above is the blunt instrument — a map of labels a node must have, all of them, exactly. It works, it is one line, and for “put this on the ARM nodes” or “put this on the GPU nodes” it is often all you need.
Node affinity is the same idea with grammar. It gives you set-based expressions (In, NotIn, Exists, Gt, Lt), and — the real reason it exists — two flavours of strictness:
requiredDuringSchedulingIgnoredDuringExecution— a hard rule. No matching node, no scheduling. This isnodeSelectorwith better syntax.preferredDuringSchedulingIgnoredDuringExecution— a soft rule with aweight. The scheduler scores nodes and prefers the matching ones, but if none match it schedules you anyway rather than leaving you Pending.
The mouthful in the middle of those names is the important part. IgnoredDuringExecution means the rule is evaluated once, when the pod is placed, and never again. Relabel the node afterwards so the pod no longer matches and nothing happens — the pod stays exactly where it is. Affinity is a placement rule, not an invariant. (Kubernetes has long reserved the option of a RequiredDuringExecution variant that would evict on mismatch; it does not exist, which is why the name is so awkward.)
Pod affinity and anti-affinity select on other pods rather than on nodes, relative to a topologyKey — a node label that defines what “together” means. podAntiAffinity with topologyKey: kubernetes.io/hostname says “do not put two of these on the same node”, which is the classic way to stop all three replicas of your API from landing on one machine and dying together. podAffinity with topologyKey: topology.kubernetes.io/zone says “put me in the same zone as the cache”, which saves a cross-zone hop and the bill that comes with it. Both are expensive to evaluate — the scheduler has to consider every pod on every candidate node, for every pod it places — and on large clusters, required anti-affinity in particular has a reputation for slowing scheduling down noticeably.
Topology spread constraints are the modern answer to the specific job that anti-affinity was being abused for:
topologySpreadConstraints:
  - maxSkew: 1
    topologyKey: topology.kubernetes.io/zone
    whenUnsatisfiable: DoNotSchedule
    labelSelector:
      matchLabels:
        app: catalog
That says: across zones, the number of catalog pods in the most-populated zone may exceed the least-populated by at most one. Anti-affinity can only say “never together” — a spread constraint can say “evenly, please, and here is how uneven I will tolerate”. whenUnsatisfiable: DoNotSchedule makes it a hard rule, and a way to end up Pending; ScheduleAnyway makes it a preference. If you are spreading replicas across zones or nodes — and you should be, because a Deployment on its own gives you no such guarantee — this is the tool, not anti-affinity.
Node affinity, pod affinity, and topology spread were not run in the lab; only nodeSelector was. Everything in this section is the documented behavior, and I am flagging it rather than dressing it up as a demonstration.
Final thoughts
Almost every scheduling problem you will ever have comes down to a mismatch between a number you wrote and a number that is real. You requested more than exists, so the pod hangs. You requested far less than you use, so the scheduler over-packs the node and the kubelet starts evicting. You set a memory limit below what the process actually touches, so the kernel shoots it every few hours and you find out from a restart counter. You set a CPU limit that felt tidy, and now your service is slow in a way that no profile explains, because the throttling is happening below the floorboards.
The uncomfortable truth underneath all of it is that Kubernetes cannot help you pick these numbers. It will faithfully enforce whatever you declare and it has no opinion about whether the declaration was any good. The scheduler believes your requests. The kernel enforces your limits. Neither of them has ever looked at what your program does.
So look at what your program does. Run it, watch its actual CPU and its actual resident memory under load, set requests near the real usage and memory limits with real headroom, and then re-check them when the workload changes — because the numbers you guessed during the first sprint are still in the manifest, and they are still the only thing the scheduler knows about you.
And when a pod goes Pending, do not stare at the Deployment. Read the census.
Comments