Ready Is a Promise About Traffic, Not About Health
Readiness withdraws traffic, liveness kills your container, and pointing the wrong one at your database will restart the entire fleet at once.
At 03:12 the database has a bad thirty seconds. A failover, a network blip, a long lock — it does not matter which, because it clears on its own and by 03:13 the database is fine. What is not fine is the rest of the estate. Every pod of the catalog service is restarting. Not one of them: all of them, at once, across every node, because every one of them ran the same health check against the same database and every one of them failed it three times in a row. The kubelets did exactly what they were told and killed the lot.
Now the catalog pods come back up — cold caches, empty connection pools, all of them hammering the database they just decided was unhealthy, at the same instant. The database, which had recovered, does not stay recovered. And the restarts continue, because the check is still failing, because the database is now genuinely overloaded by the stampede of pods that restarted because the database was briefly slow.
A thirty-second blip has become a twenty-minute outage, and every single restart in it was a Kubernetes feature working perfectly. Someone pointed a livenessProbe at a dependency. This chapter is about why that one line of YAML is the most destructive thing in the health API, and about the two probes that people confuse because they look identical and do completely different things.
Three probes, and only one of them can kill you
Kubernetes offers the kubelet three questions to ask your container. They share a syntax, which is most of the problem.
| probe | the question it asks | what a failure does |
|---|---|---|
readinessProbe | should this pod receive traffic? | traffic stops being routed to it |
livenessProbe | should this container be killed? | kills and restarts the container |
startupProbe | has this container finished booting yet? | holds the other two probes back, then kills if boot never completes |
That table is the chapter — everything else is detail and consequence. Reading it is one thing; watching the two behave differently on a running cluster is another, so let us break a pod on purpose. The bookshop’s services expose /debug/unready and /debug/break, which flip the readiness and liveness state at runtime, and they exist for no reason other than this experiment. The web Deployment has two replicas, a readiness probe on /readyz every 3 seconds, and a liveness probe on /healthz every 5.
Failing readiness: nothing dies
Pick one of the two web pods — the one at 10.244.1.17 — and tell it to stop being ready. The switch is an endpoint on the app itself, and the app is listening on :8080 inside its own pod, so you have to make the request from in there. kubectl exec runs the command in the container, where localhost means what you want it to mean:
POD=$(kubectl get pod -n bookshop -l app=web -o jsonpath='{.items[0].metadata.name}')
kubectl exec -n bookshop $POD -c web -- curl -s http://localhost:8080/debug/unready
(If you prefer to drive it from your own shell, kubectl port-forward -n bookshop $POD 8080:8080 maps the pod’s port onto your laptop for as long as the command runs, and then a plain curl http://localhost:8080/... does work. Either is fine. What does not work is curling localhost:8080 with nothing forwarding it — the only thing this cluster maps to your machine is the NodePort on 30080, and that fronts the web Service, which would send you to a random replica rather than the one you are trying to break.)
Ten seconds later:
READY 0/1 STATUS Running RESTARTS 0Read all three columns. 0/1 — the container is not ready. Running — the pod is up, and Kubernetes considers the situation completely normal. RESTARTS 0 — nothing was killed. No SIGTERM, no restart, no event that sounds like a problem. The container is running the same process it was running a minute ago, and it will keep running it for as long as you like.
Meanwhile, the Service keeps serving 200s — every one of them from the other replica, which absorbed the whole load without noticing. That is readiness working: a pod said “not me right now”, and the routing quietly went around it.
Flip it back with /debug/ready and the pod returns to 1/1 and starts taking traffic again within about eight seconds — the probe period (3s) plus the endpoint update plus the time for kube-proxy to reprogram the node. So “ready” is not instantaneous in either direction, a point that comes back at the end of this chapter.
What actually happens to the EndpointSlice (and it is not what you think)
Every explanation of readiness you have read says some version of “the pod is removed from the Service’s endpoints”. I said it myself, in my first pass at this chapter, and then I went and looked at the object.
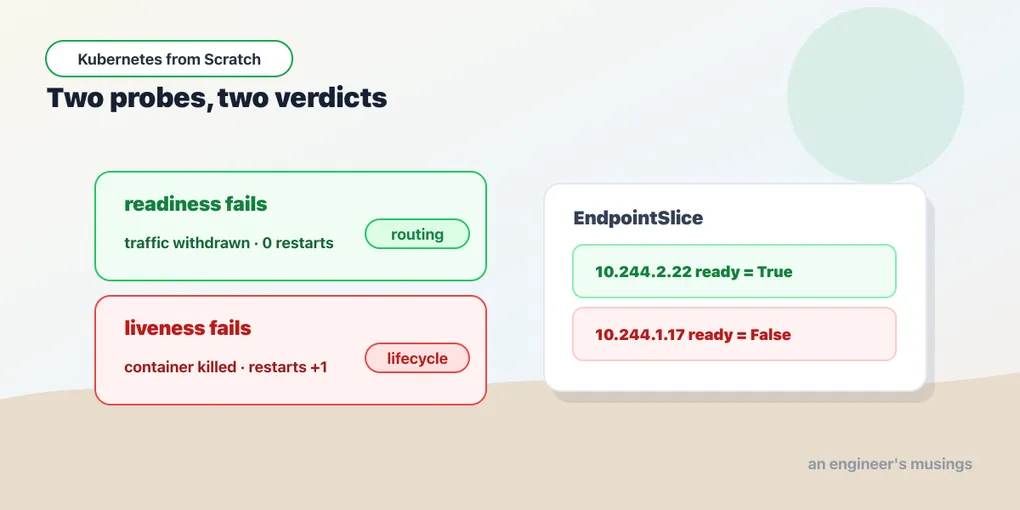
The address is not removed. It stays in the EndpointSlice. What changes are its conditions:
10.244.2.22  ->  ready = True    serving = True     (the healthy pod)
10.244.1.17  ->  ready = False   serving = False    (the pod we just broke)
Both addresses are still listed. The unready one is still there, with its IP, its target ref, its node name, all of it. What flipped is a boolean. And kube-proxy — the thing that actually programs the packet-forwarding rules on each node — excludes endpoints whose ready condition is false when it builds those rules. That exclusion is where the traffic actually stops, one layer below the object you are reading.
So “the pod is removed from the Service” is true in effect and false in the object, and the distinction is not pedantry, it is the difference between a debugging session that works and one that does not. When you are staring at kubectl get endpointslice -o yaml at 3am trying to work out why a pod is not getting traffic, you will see its IP sitting right there in the list and conclude the routing is broken. It is not. Read the conditions. ready: false is the answer, and it is telling you the pod’s own readiness probe is failing — which points you at the application, not at the network.
There is a second condition in that output, and it exists for a subtle reason. ready and serving are usually the same, as they are here — they come apart during termination. When a pod is shutting down, Kubernetes forces ready to false (so nothing new is routed to it) while serving continues to report what the probe actually says, so a component that cares — a Gateway implementation draining connections, say — can tell the difference between “shutting down but still answering” and “genuinely broken”. A third condition, terminating, says which case you are in. I did not stage a termination race to watch ready and serving diverge, so take that as the documented semantics rather than a lab result; what the lab does show is that in a plain readiness failure, both go false together.
Failing liveness: the kubelet reaches for the gun
Same pod. Different endpoint. Same trick to reach it — from inside the container:
kubectl exec -n bookshop $POD -c web -- curl -s http://localhost:8080/debug/breakTwenty-five seconds later:
READY 1/1 STATUS Running RESTARTS 1The container was killed and restarted, came back healthy, and is serving again. And the pod name did not change. This is the part people get wrong in the other direction: a liveness failure does not create a new pod. It does not reschedule anything. It does not touch the Deployment or the ReplicaSet. The kubelet — which is a per-node agent, running on the node your pod is already on — kills the container and starts it again inside the same pod, on the same node, with the same name and the same IP.
The events, verbatim:
Warning  Unhealthy  14s (x3 over 24s)  kubelet  Liveness probe failed: HTTP probe failed with statuscode: 500
Normal   Killing    14s                kubelet  Container web failed liveness probe, will be restarted
Note who is speaking. kubelet — not the scheduler, not a controller, not the API server. This decision was made entirely on the node, by the agent that owns the container, and the API server only found out afterwards.
And note the (x3 over 24s). Three failures, over twenty-four seconds, before the kill. That is failureThreshold: 3 — the default — multiplied by periodSeconds: 5. Which means the container ran, broken and returning 500 to every real user request, for roughly fifteen seconds after it broke, before anything happened to it. That is not a bug. It is the point.
Probe timing is a budget, not an instant. Your detection latency is periodSeconds × failureThreshold in the worst case, plus up to timeoutSeconds for the failing check itself. Make the threshold 1 and a single dropped packet restarts your container. Make it 10 with a 30-second period and your wedged process serves errors for five minutes. There is no setting that is both instant and safe, and choosing where to sit on that line is the actual engineering in a probe — not the YAML.
The one-line distinction, and why it is worth memorizing
Readiness = “should this pod receive traffic?” — a routing decision. It controls EndpointSlice conditions. Liveness = “should this container be killed?” — a lifecycle decision. It controls the restart counter.
That is it. They are not two strengths of the same check. They are not “warning” and “critical”. They answer different questions, they are consumed by different components — readiness by the endpoints controller and kube-proxy, liveness by the kubelet — and they have entirely different blast radii. A readiness failure is reversible, free, and local — the pod stops taking traffic and the other replicas absorb it. A liveness failure is destructive: it terminates a process, discards its in-memory state, its warm caches, its connection pools, and its in-flight requests, and then bets that the new process will be better than the old one.
Which brings us to the rule.
Never point a liveness probe at a dependency
A liveness probe must only ever test the process itself. Is this thing wedged? Is the event loop spinning? Is the HTTP server accepting connections at all? Those are questions a restart can plausibly fix.
The moment a liveness probe touches something outside the container — a database, a cache, another service, a message broker — you have built the outage from the opening of this chapter. Work through the logic and you can see there is no version of it that ends well:
It is simultaneous. Every replica of the service checks the same dependency, and when that dependency goes away they all fail their checks within the same probe period. There is no partial degradation and no jitter to save you: they all die at the same moment, and you lose 100% of your capacity, not some of it.
It does not fix anything. Restarting a container has precisely zero effect on whether someone else’s database is up. So the new container starts, checks the database, fails, and is killed again. And again. The kubelet’s restart backoff — CrashLoopBackOff — will eventually slow this down, which is the only mercy in the whole scenario, and it arrives after the damage.
It makes the dependency worse. A fleet of freshly-restarted pods reconnecting all at once, with empty pools and cold caches, is precisely the load profile that turns a recovering database into a failing one. You have built a positive feedback loop that starts with a blip and ends with a war room.
It throws away the thing that would have saved you. Your process, before you killed it, was holding a connection pool, a cache, and possibly a queue of work it could have served or retried. Now it is holding nothing.
Point liveness at the process. Point readiness at the dependencies. Then a database outage produces a fleet of Running, 0/1, unready pods that serve no traffic, hold their state, keep retrying quietly, and come back the instant the database does — and the Service returns a fast, honest failure instead of a slow one, because it has no ready endpoints to route to. That is a degraded service. The other thing was a self-inflicted outage.
The bookshop’s catalog does exactly this, and the shape of it is small enough to copy. On startup, if DATABASE_URL is set, it launches one goroutine:
go func() {
    for {
        if err := db.Ping(); err != nil {
            log.Printf("catalog: database not reachable: %v", err)
            h.SetReady(false)
        } else {
            h.SetReady(true)
        }
        time.Sleep(3 * time.Second)
    }
}()
That loop moves readiness, and only readiness. /readyz reports the flag it sets — /healthz, the liveness endpoint, never consults it and returns ok as long as the HTTP server is answering at all. So when Postgres goes away, the catalog pods go 0/1 and stop receiving traffic. They do not restart. They keep pinging. When Postgres comes back, the next ping succeeds, readiness flips, the endpoint conditions flip, and traffic resumes without a single container having died. The whole difference between the outage in the opening and a shrug is which of two Go methods that db.Ping() failure calls.
If you take one thing from this chapter, take that. And take the corollary, which feels wrong the first time you hear it: it is entirely reasonable to have no liveness probe at all. If your process reliably crashes when it is broken — and a Go binary that panics, or a Node process that exits, generally does — the container exits, the kubelet restarts it, and you got the restart for free with no probe involved. A liveness probe only earns its keep for the specific failure mode where the process is alive but wedged: a deadlock, an exhausted thread pool, an event loop stuck in a spin. If you cannot name the wedge you are protecting against, you have added a mechanism that can only hurt you.
Startup probes, and the boot-time trap they solve
There is a failure that follows directly from everything above. Your app takes ninety seconds to boot — a JVM warming up, a large model loading into memory, a migration running at startup. Your liveness probe has a 10-second period and a threshold of 3, so it starts killing at around thirty seconds. The container never finishes booting. It is killed, restarts, gets thirty seconds, is killed again. CrashLoopBackOff, forever, for an application that would have worked perfectly if anyone had let it finish.
The old fix was initialDelaySeconds: 120 on the liveness probe, which “works” and is bad — you have now told the kubelet to ignore a wedged container for the first two minutes of every restart, including the ones long after boot, and if the boot time ever grows past your guess you are back where you started.
The startupProbe is the real fix. While it is failing, the liveness and readiness probes do not run at all. Once it succeeds once, it never runs again, and the other two take over. So you give it a generous budget:
startupProbe:
  httpGet: { path: /healthz, port: http }
  periodSeconds: 5
  failureThreshold: 60     # 5 × 60 = up to five minutes to boot
livenessProbe:
  httpGet: { path: /healthz, port: http }
  periodSeconds: 5
  failureThreshold: 3      # once booted, 15 seconds to detect a wedge
Five minutes to start, fifteen seconds to detect a hang afterwards, and the two numbers no longer fight each other. That is the pattern: a slow, forgiving startup probe and a fast, strict liveness probe, pointed at the same endpoint. If the app never boots at all, the startup probe eventually exhausts its threshold and the container is killed — so you still get the crash loop, you just get it after five minutes instead of thirty seconds, and it now means something.
Startup probes were not exercised in the lab; the readiness and liveness behavior in this chapter was. The mechanism above is the documented one, and it is the part of the health API that most reliably fixes a real, common bug.
The four ways to ask, and the four knobs to tune
Every probe uses one of four handlers.
httpGet is the default choice and what the bookshop uses everywhere. Any response code from 200 to 399 counts as success — 400 and up is a failure, which is why the liveness event above says HTTP probe failed with statuscode: 500. It runs from the kubelet on the node, straight to the pod IP, so it does not pass through any Service and cannot be tricked by a routing problem.
exec runs a command inside the container and treats exit code 0 as success. It is the right answer when there is nothing to serve over HTTP — the bookshop’s Postgres uses it, because Postgres speaks its own protocol rather than HTTP:
readinessProbe:
  exec:
    command: ["pg_isready", "-U", "bookshop", "-d", "bookshop"]
  periodSeconds: 5
Exec probes have a real cost: they fork a process inside your container, every period, forever. At a 1-second period across a thousand pods that is a thousand process spawns a second, and exec probes are a well-known contributor to kubelet CPU on busy nodes. Use them where you need them, and do not use a 1-second period.
tcpSocket just opens a TCP connection and closes it. It is the weakest check in the book, and you should know exactly why: the kernel accepts the connection. A process that is completely deadlocked, whose application threads are all blocked, whose event loop has not turned in an hour, will still have an open listening socket with a backlog, and tcpSocket will happily call it healthy. A TCP probe proves that the port is bound. It proves nothing at all about whether anything is behind it.
grpc is the fourth, for services that implement the standard gRPC health-checking protocol; it removes the old workaround of shipping a grpc_health_probe binary and calling it with exec. Not exercised in the lab — mentioning it so you do not go hunting for that binary in 2026.
And the knobs, which are the same on all three probes:
initialDelaySeconds(default 0) — wait this long before the first check. Mostly obsoleted bystartupProbe; still useful to shave noise.periodSeconds(default 10) — how often to check.timeoutSeconds(default 1) — how long a single check may take before it counts as a failure. This default is the one that bites. A one-second timeout against a service that occasionally takes 1.2 seconds under load, on a probe with a threshold of 3, is a container that restarts itself whenever it gets busy — which reduces capacity, which makes it busier. If your health endpoint does anything at all beyond returning a constant, raise this.failureThreshold(default 3) — consecutive failures before action. This is thex3in the event above.successThreshold(default 1) — consecutive successes before a pod is considered ready again. It may only be 1 for liveness and startup probes; readiness is the only one you can raise it on, which is occasionally useful for a flapping dependency.
The rule of thumb that survives contact with production: make readiness fast and twitchy, and make liveness slow and reluctant. A false readiness failure costs you one replica’s worth of traffic for a few seconds, and nothing else — a false liveness failure costs you a process. Price them accordingly.
What Ready does not promise
One more thing, and it closes a loop opened three chapters ago.
A pod being Ready means one thing — its readiness probe passed on the node it is running on. That is all. It does not mean traffic is reaching it yet, and it does not mean traffic has stopped reaching it after it stops being ready. Between the probe result and the actual packet-forwarding rules on every node in the cluster there is a chain — the kubelet updates the pod’s status, the API server records it, the endpoints controller updates the EndpointSlice, every kube-proxy in the cluster watches that and reprograms its own node’s rules — and every link in that chain is asynchronous and takes time. It is fast. It is not atomic.
That gap runs in both directions, and both of them are visible.
On the way in, a pod can be Ready and reported as such while a node somewhere in the cluster has not yet added it to its forwarding rules. It looks like traffic ramping up rather than snapping on. Mostly harmless.
On the way out, it is not harmless, and this is exactly the race the chapter on Deployments measured. When a pod is deleted during a rolling update, two things happen in parallel: the kubelet sends SIGTERM to your container, and the endpoints controller starts withdrawing the address from the EndpointSlice. There is no ordering between them. So your process can begin shutting down while a kube-proxy on some other node is still, for another few hundred milliseconds, sending it live requests — and those requests hit a closing listener and fail. That is where the failed requests in a “zero-downtime” rolling update come from, and it is why the fix is a preStop hook that does nothing but sleep: it delays the SIGTERM long enough for the endpoint withdrawal to finish propagating, so that by the time your process starts closing, nothing is routing to it any more.
Readiness cannot fix that, because readiness is not the thing being raced. Removing a pod from a Service on shutdown is not a probe result — the pod is deleted, and the probe is irrelevant. What readiness gives you is control over the steady state — which pods get traffic while everything is running normally. What preStop and terminationGracePeriodSeconds give you is control over the transition. You need both, and neither substitutes for the other.
There is one more consumer of readiness, and it is the one that quietly protects you: the Deployment controller counts Ready pods when it rolls. maxUnavailable and maxSurge are counted in Ready pods, not Running ones. So a Deployment with a working readiness probe will stall a rollout when the new pods do not become ready — it will not proceed to delete the old ones, and after progressDeadlineSeconds (600 by default) it marks the rollout as ProgressDeadlineExceeded and stops, with your old version still serving. A Deployment with no readiness probe considers a pod ready the instant the container process starts, will happily tear down the old ReplicaSet while the new pods are still initializing, and will report the rollout a success while the service is down. The readiness probe is not just a routing switch — it is the safety catch on every deploy you do, and if you leave it off, the catch is off too.
Final thoughts
The health API looks like monitoring. It is not monitoring — it is a control system, and the two probes are actuators wired to different machinery: one moves traffic, the other ends processes. When people write a single /health endpoint that checks the database, the cache, and three downstream services, and then point both probes at it because it seemed thorough, they have not been careful — they have wired the “kill everything” actuator to a signal that fires whenever anyone else has a bad minute.
Thoroughness is the wrong instinct here. The right question for a liveness probe is not “is everything fine?” but “would killing this container help?” — and for almost every check you might be tempted to add, the honest answer is no. A wedged event loop, yes. A deadlocked thread pool, yes. A database that is having a moment, absolutely not. Restarting your process has never once fixed someone else’s Postgres, and it never will.
Readiness is where thoroughness belongs, because withdrawing from traffic is a cheap, reversible, honest statement about the world: I am up, I am fine, and right now I cannot do my job. A cluster full of pods saying that is not an outage — it is a system telling you exactly where the problem is, and waiting, intact, for it to be fixed.
Comments