Three Systems Could Have Refused That Request
A mesh adds a debugging surface that did not exist before, and its failures are the ones that look like something else — so learn the shape of each denial, and never trust a measurement taken on a dirty cluster.
The call fails. That is all you have.
$ curl http://catalog.bookshop/books
  http=000
  curl exit=56
No status code — there was no HTTP response. Nothing in the application’s log — the application never received a request to log. Nothing in kubectl get pods, because every pod is Running and every pod is Ready. You have an exit code from curl and a shrug from Kubernetes, and somewhere between the process that made the call and the process that should have answered it, something said no.
Before the mesh, that sentence had two possible endings. Your application refused, or Kubernetes refused — a Service selector that matches nothing, a readiness probe that has taken the pod out of rotation, a NetworkPolicy, a crashed container. Both of those are well-trodden ground, and the Kubernetes book’s debugging chapter is the map for them — describe first, read the events, read lastState.terminated, and do not believe the folklore about --previous. That chapter still applies, in full, and I am not going to repeat it.
The mesh adds a third ending, and it is the unfamiliar one. There is now a proxy on every node and possibly an Envoy in front of your Service, and both of them are entitled to refuse a request, drop a connection, manufacture a status code, retry something you never saw fail, or eject the backend you were trying to reach. None of that is in your application’s log. Most of it is not in Kubernetes’ events either. And — this is what makes mesh debugging a discipline rather than a chore — the mesh’s failures do not look like mesh failures. They look like network failures, or application failures, or nothing at all.
This chapter is a flowchart for that. What to run, in what order, and how to read the shape of a failure to find out which of the three systems is the one that refused you.
Where the request actually goes now
You cannot debug a path you cannot draw, so draw it once.
A call from orders to catalog in an ambient mesh leaves the orders pod and is captured, transparently, by ztunnel on that node — an L4 proxy that terminates and originates mTLS over HBONE, carries a SPIFFE identity, and forwards bytes. It cannot read an HTTP method, because it does not speak HTTP. That was chapter six of the foundations.
If catalog has a waypoint bound to it, the connection goes through that waypoint next — a real Envoy, a real pod, which parses the HTTP request, applies L7 policy, applies routes and timeouts and retries, and can compose an HTTP response of its own. If catalog has no waypoint, this hop does not exist, and no part of the mesh has read a single byte of your HTTP request. That was chapter seven, and it is the single most load-bearing fact in this book.
Then ztunnel again on the destination node, then the pod.
So: two mesh hops — one of them optional — plus everything Kubernetes was already doing. Four places to refuse a request, and each of them refuses in a different dialect.
Run istioctl analyze first. Every time.
Before you look at a single pod, ask Istio what it thinks of its own configuration.
$ istioctl analyze -n bookshop
Warning [IST0171] (AuthorizationPolicy bookshop/catalog-l7) A condition with a negative status is
present: type=WaypointAccepted, reason=AncestorNotBound, message=Service bookshop/catalog is not
bound to a waypoint.
Info [IST0118] (Service bookshop/postgres) Port name pg (port: 5432, targetPort: pg) doesn't follow
the naming convention of Istio port.
Two findings, both real, and both worth the thirty seconds.
IST0171 is the fail-open footgun, caught statically. An AuthorizationPolicy with an L7 rule, bound to a Service that has no waypoint in front of it, is not a stricter policy — it is an unenforced one, and it enforces nothing while looking entirely healthy. That is the eleventh chapter of the foundations and it is the most dangerous single behaviour in ambient mode. analyze sees it, names it, gives it a code you can grep for, and tells you in plain English what is wrong: Service bookshop/catalog is not bound to a waypoint.
IST0118 is a defect in my own manifests, found in the same breath. The bookshop’s Postgres Service names its port pg. Istio infers a port’s protocol from its name — tcp-, http-, grpc- and friends — or from appProtocol, and pg tells it nothing, so it cannot classify the port. I wrote that Service, in a previous book, and never noticed. analyze noticed the first time I pointed it at the namespace. (The warning is what I ran; the downstream consequence — Istio falling back to treating an unclassifiable port as opaque TCP — is documented behaviour I did not separately test.)
The reason to run this in CI is not that it is a nice linter. It is that analyze is the only tool in the box that catches the well-formed object that lands nowhere. You cannot catch that class by reading the YAML, because the YAML is fine — it is valid, it applied without error, it is in Git, a colleague approved it, and it is inert. A policy that is enforcing perfectly and a policy that is enforcing nothing look identical to every other tool you own. analyze is the one that can tell them apart — and a pipeline that runs it on every change to a mesh manifest catches the fail-open before it reaches a cluster, which is the only place it is cheap to catch.
And be clear about what analyze is not. It reads configuration — it does not read the running system. It will not tell you that a pod is serving 500s, that a host has been ejected, that your egress lockdown stopped locking after a migration, or that the number you just measured is wrong. Everything else in this chapter exists because analyze cannot do those things.
The .status field, and the column that isn’t there
Istio’s CRDs write their opinion of themselves into .status, and almost nobody reads it, for a reason that is not their fault.
Here is the unenforced policy from a moment ago:
$ kubectl get authorizationpolicy catalog-l7 -n bookshop -o jsonpath='{.status}'
  {
      "conditions": [
          {
              "lastTransitionTime": "2026-07-14T02:52:07.824582232Z",
              "message": "Service bookshop/catalog is not bound to a waypoint",
              "observedGeneration": "1",
              "reason": "AncestorNotBound",
              "status": "False",
              "type": "WaypointAccepted"
          }
      ]
  }
WaypointAccepted: False. reason: AncestorNotBound. Deploy a waypoint and the same field flips, with no edit to the policy:
WaypointAccepted=True (Accepted)The object knew all along. And here is the command you will actually type:
$ kubectl get authorizationpolicy -n bookshop
NAME         ACTION   AGE
catalog-l7 ALLOW 29sNAME, ACTION, AGE. No status column. No health column. The inert policy and the enforcing policy print the same row, forever, and this is not a bug — it is a direct consequence of something we built by hand in the CRDs and controllers chapter. A custom resource shows exactly the columns its author declared in additionalPrinterColumns, and no others. Istio’s author chose name, action, age. The health of the object was not on the list, so it is invisible to kubectl get, by construction, for every AuthorizationPolicy that will ever exist.
Which means: on a mesh object, kubectl get is not a health check. Read .status or read nothing.
There is a symmetry here that is worth holding onto, because .status can mislead you in the other direction too. The ingress Gateway in the lab reports this, permanently:
Accepted=True  reason=Accepted
Programmed=False  reason=AddressNotAssigned
  Assigned to service(s) bookshop-gw-istio.bookshop.svc.cluster.local:80, but failed to assign to
all requested addresses: address pending for hostname "bookshop-gw-istio.bookshop.svc.cluster.local"PROGRAMMED=False, and it has served every request I have ever sent it. kind has no cloud load-balancer controller, so the LoadBalancer Service never gets an external IP, so the Gateway never gets an address, so Programmed never becomes true — and none of that has anything to do with whether traffic flows. On kind, PROGRAMMED=False on an ingress Gateway is the expected steady state. The waypoint, which is a ClusterIP and needs no load balancer, is PROGRAMMED=True.
So one object under-reports its failure and another over-reports it, and the only defence is to know which condition means what on which kind. WaypointAccepted=False on an AuthorizationPolicy is an emergency. Programmed=False on a Gateway on a laptop is a Tuesday.
Asking ztunnel what it can see
istioctl ztunnel-config is the window into the L4 data plane, and it answers the two questions you will ask most often at 3am: is this pod even in the mesh, and is there a waypoint in this path.
$ istioctl ztunnel-config workload
NAMESPACE   POD NAME                            ADDRESS      NODE              WAYPOINT PROTOCOL
bookshop    catalog-8c6d8db8c-2kd49             10.244.1.57  k8s-lab-worker    None     HBONE
bookshop    catalog-8c6d8db8c-7fp5c             10.244.2.38  k8s-lab-worker2   None     HBONE
bookshop    orders-db6c9c86c-blbfb              10.244.2.39  k8s-lab-worker2   None     HBONE
bookshop    postgres-84bfd89b75-lmppf           10.244.2.42  k8s-lab-worker2   None     HBONE
bookshop    shelf-controller-6f9877c9bd-csd2h   10.244.2.45  k8s-lab-worker2   None     HBONE
bookshop    web-57b4dcbd6b-92qtr                10.244.1.59  k8s-lab-worker    None     HBONE
bookshop    web-57b4dcbd6b-gqlrz                10.244.2.44  k8s-lab-worker2   None     HBONE
PROTOCOL: HBONE means ztunnel has this workload, is tunnelling its traffic, and is presenting its identity. A pod that is not in the mesh is simply absent from this table — which is the fastest possible answer to “did the enrolment actually take”, and the question to ask before you spend twenty minutes debugging a policy that was never going to apply to a pod the mesh has never heard of.
Two traps, both of which I walked into, and both of which will cost you time in exactly the moment you have none.
The -n flag means ztunnel’s namespace, not your workload’s. This is a ztunnel-config command, and ztunnel lives in istio-system:
$ istioctl ztunnel-config workload -n bookshop
Error: failed retrieving: daemonsets.apps "ztunnel" not found in the "bookshop" namespace
Every other kubectl-shaped command you have typed in your life reads -n as “the namespace of the thing I am asking about”. This one reads it as “the namespace of the proxy I am asking” — a different question with the same flag. The workload table already spans namespaces; you filter it with grep, not with -n.
And WAYPOINT: None in that table is correct even when the waypoint is working. Look at the column above: None, on every pod, including pods whose Service is behind a functioning waypoint that is returning 403s as you watch. It is right, and it is right because waypoints bind to Services, not to workloads. The per-pod view is not the view that can answer the question. This one is:
$ istioctl ztunnel-config service
NAMESPACE    SERVICE NAME    SERVICE VIP     WAYPOINT ENDPOINTS
bookshop     catalog         10.96.228.164   waypoint 2/2
bookshop     orders          10.96.2.2       waypoint 1/1
bookshop     postgres        10.96.56.90     waypoint 1/1
bookshop     waypoint        10.96.245.53    None     1/1
Two views, two answers, both true, and the one that matters is the one that matches how the object is actually bound. If you take one habit from this section: when someone tells you their waypoint is broken because WAYPOINT says None, ask them which table they were reading.
The third subcommand is the one you reach for when identity is the suspect:
$ istioctl ztunnel-config certificate
Error: ztunnel pod name or --node must be set
It will not guess. Give it a node, and it hands you the actual certificates ztunnel is holding for the workloads on that node:
CERTIFICATE NAME                                TYPE   STATUS      VALID  NOT AFTER              NOT BEFORE
spiffe://cluster.local/ns/bookshop/sa/default   Leaf   Available   true   2026-07-15T02:49:49Z   2026-07-14T02:47:49Z
spiffe://cluster.local/ns/bookshop/sa/default   Root   Available   true   2036-07-11T02:49:18Z   2026-07-14T02:49:18Z
A 24-hour leaf and a ten-year root, which is chapter five of the foundations. But read the SPIFFE name, because that output predates the moment we fixed the bookshop’s identity hygiene — and it is the diagnosis for an entire category of confusing policy behaviour. Every service in that namespace was running as sa/default, so every service had the same identity, so an identity-based policy could not tell web from orders from a compromised debug pod. If a principal-based policy is allowing a caller it should be refusing, this command is where you find out that the two callers you thought were different are — to the mesh — the same one.
(There is a fourth tool I did not exercise in this lab and am therefore pointing at rather than demonstrating: istioctl proxy-config, which dumps the listeners, routes and clusters an Envoy has actually been programmed with — a gateway, a waypoint, a sidecar. When you need to know not “is there a waypoint” but “what did the waypoint actually compile my HTTPRoute into”, that is the command. I never needed it here; you will, eventually.)
Prometheus, and the absence that is a diagnosis
The mesh’s metrics are free, on by default, and attributed by workload identity, and I spent a whole foundations chapter on them. For debugging, one label does most of the work.
$ sum(istio_requests_total{destination_service_name="catalog"}) by (source_workload,response_code,reporter)
  source=web                reporter=waypoint  code=200   requests=134
  source=orders             reporter=waypoint  code=200   requests=132
  source=orders             reporter=waypoint  code=500   requests=46
  source=web-canary         reporter=waypoint  code=200   requests=7
  source=orders             reporter=waypoint  code=403   requests=2
  source=bookshop-gw-istio  reporter=source    code=200   requests=1
  source=orders             reporter=waypoint  code=504   requests=1
reporter=waypoint means an Envoy in the path parsed the HTTP request and counted it — methods, paths, response codes, the lot. reporter=source or reporter=destination means ztunnel: bytes, connections, identities, and nothing about HTTP at all, because ztunnel has never seen any HTTP.
That distinction gives you a diagnostic that people miss entirely, so I will state it as a rule:
If a Service has no L7 metrics, that is not a gap in your monitoring. It is a fact about your mesh: there is no waypoint in that Service’s path.
An empty graph is usually a broken exporter. Here it is a working exporter faithfully reporting that nothing in the path is capable of counting HTTP — which means nothing in the path is capable of enforcing HTTP either: no L7 policy, no method rules, no path rules, no timeouts, no retries. The absence of the metric and the absence of the enforcement are the same absence. You can read your security posture off a Grafana panel that has no lines on it.
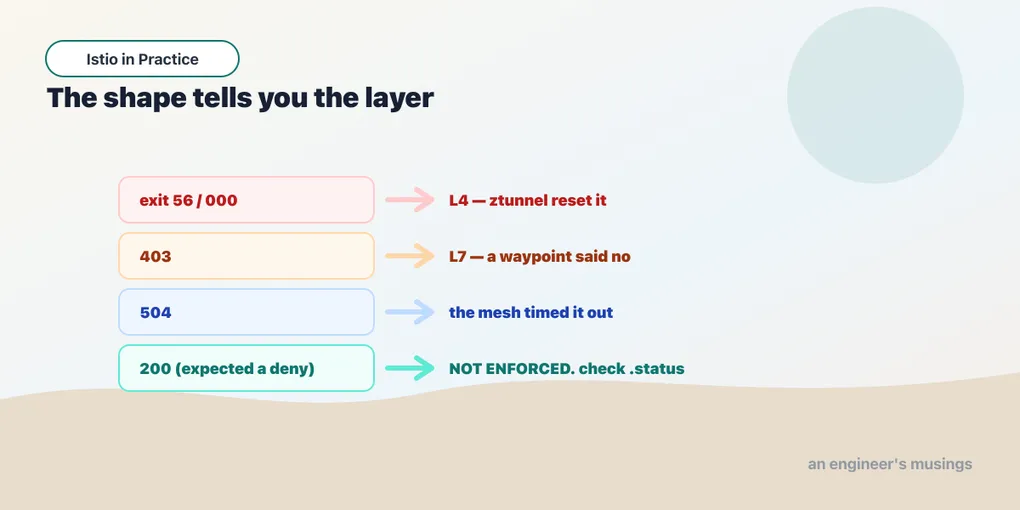
The shape of the failure names the layer
Here is the flowchart, and it is the reason to read this chapter. Every one of these came off the lab cluster.
| What the caller sees | Who did it | Where to look |
|---|---|---|
http=000, curl exit=56, no response | L4 — ztunnel reset the connection | the mesh, or the pod is gone |
| 403 | L7 — a waypoint read your request and refused | AuthorizationPolicy with L7 rules |
| 401 | a JWT was present and failed validation | RequestAuthentication |
| 503 | no healthy upstream, or an injected abort | routing, ejection, fault config |
| 504 | a timeout the mesh enforced | HTTPRoute / VirtualService timeouts |
| 500 | your application | your application |
| 200 when you expected a denial | nothing is enforcing your policy | .status, istioctl analyze |
| 502 from a sidecar pod, 200 from an ambient pod | the egress lockdown does not apply in ambient | your migration |
Now the readings, because a table is not an explanation.
http=000 and exit 56. curl’s manual: recv failure: connection reset by peer. The TCP connection was established and then destroyed, with no status line, no headers, no body. That is what an L4 denial looks like, and it is the only denial ztunnel can express — to send a 403 you must compose HTTP, and ztunnel is not an HTTP server. So an identity policy refusing a caller produces a dead socket and a puzzled client, and nothing anywhere in your HTTP dashboards. The trap is that this is also what a pod that has just gone away looks like — the same 000 the rolling-update chapter produced when a request reached a socket that had closed a moment earlier, and the same thing you get from a Service whose selector matches nothing. Three causes, one symptom. Disambiguate with the mesh’s own tables: is the destination pod in ztunnel-config workload? Is there an AuthorizationPolicy with a selector: and principals: that names — or fails to name — the caller? And remember that in a deny-by-default world, a policy that forgets to allow a caller and a policy that denies it are the same policy.
403. Something in the path spoke HTTP and said no. In ambient that something is a waypoint, which means the request got as far as an Envoy, which means the L7 policy you wrote is not merely present but running. A 403 is, perversely, good news about your control plane. It is also what you get from an AuthorizationPolicy requiring requestPrincipals when the caller sent no token at all, which is chapter eight and not the same failure as the next row.
401. A token was present and it did not validate — expired, wrong issuer, wrong signature, garbage. This is RequestAuthentication doing its narrow job. And the trap that makes this row dangerous is the one that isn’t here: no token at all does not produce a 401. It produces a 200. RequestAuthentication validates a token if one is present and does not require one to be. If you are debugging “why is unauthenticated traffic getting through”, the answer is almost never in the RequestAuthentication — it is that you never wrote the AuthorizationPolicy that requires a principal.
503. Four sources, and they are worth separating. A fault.abort you configured — in which case the waypoint manufactures the response and your application never sees the request, so check for a VirtualService with a fault block before you go looking for a bug in code that was never executed. Or no healthy upstream: every endpoint is gone, or every endpoint has been ejected. Outlier detection with consecutive5xxErrors: 3 and maxEjectionPercent: 50 is a machine that removes hosts from the pool — and if your hosts are failing faster than they recover, it will do exactly what you told it to. That maxEjectionPercent is not decoration; it is the thing standing between a bad deploy and an ejected fleet.
And the fourth, which is the one that will cost you the most time, because it does not look like a policy failure at all: an L4 denial, arriving through a waypoint, is reported to the caller as a 503. When the caller is in the mesh and the destination Service has a waypoint, the caller does not touch the destination’s ztunnel — the waypoint does, on its behalf. So when that ztunnel resets the connection because an L4 policy refused it, the socket that dies is the waypoint’s, and the waypoint does what any proxy does with a dead upstream: it composes a 503 and hands it to you. Same denial, three different faces depending on where you are standing:
bypasses the waypoint   ->  http=000, curl exit 56
through the waypoint    ->  503
an L7 rule at the waypoint ->  403
So a service that is healthy, fully replicated, and returning 503s to exactly one caller is not a capacity problem. Read the L4 policies before you read the replica count. (And note the trap in the waypoint chapter: the destination authorizes on the waypoint’s identity, not the caller’s, so an L4 policy naming the caller will refuse everyone who comes through the waypoint.)
504. The mesh gave up. A timeout on an HTTPRoute whose parentRef is a Service is enforced by the waypoint, and it is enforced against the application’s latency without the application knowing anything about it. In the lab, a 1s timeout against /debug/slow?ms=3000 produced a clean 504, and the same route against /debug/slow?ms=200 produced a 200. If you are seeing 504s and your app’s own latency histogram shows nothing unusual, the app is right and your timeout is too tight. The mesh is not reporting the slowness — it is causing the failure, on purpose, because you asked it to.
500. The mesh does not manufacture 500s. That is your process, and now you are back in the Kubernetes debugging chapter, which is where you wanted to be all along.
200 when you expected a denial. This is the most dangerous line in the table — and it is the one that will not page you. The policy applied. kubectl get shows a healthy row. And DELETE /books, which the policy explicitly forbids, returns 200 — because the policy is an L7 rule bound to a Service with no waypoint in front of it, and nothing in the cluster has been asked to enforce it. It does not error, it does not warn, and it fails open — the direction a security control is designed never to fail in. Check .status. Run analyze. And understand why this is the entry you have to know by heart: it is the only one on the list that produces no failure at all. Every other row hands you a symptom. This one hands you a green cluster and a control you do not have.
502 from one pod and 200 from another, on the same egress, in the same cluster. That is the migration regression from chapter seven: outboundTrafficPolicy: REGISTRY_ONLY is enforced by the sidecar Envoy, and ztunnel does not implement it. Two data planes, one setting, two behaviours. If your egress lockdown is still working for the namespaces you have not migrated yet, its continued working is not evidence of anything.
The measurement was wrong and Istio was innocent
Now the part of this chapter I did not plan to write.
I was measuring fault injection for chapter four — a VirtualService with fault.abort, which tells the waypoint to fail a configured percentage of requests without ever forwarding them. It is a simple thing to verify. Ask for 50%, send two hundred requests, count the failures, expect about a hundred.
I asked for 50% and measured 70%. I asked for 20% and measured 44%.
Those are not noise. Two hundred requests at a true 50% rate has a standard deviation of about seven requests — three and a half percentage points — and I was forty requests off. Both measurements were wrong in the same direction, by roughly the same multiplicative factor, which is the fingerprint of a mechanism rather than a fluctuation. And the first explanation that comes to mind — the one I spent time on — is that Istio’s percentage means something other than what I think it means. Perhaps the abort is applied per-retry. Perhaps the waypoint is double-counting. Perhaps 1.30 changed the semantics and the documentation has not caught up.
It was none of that. It was me.
Some experiments earlier, testing outlier detection, I had poisoned one of the three catalog pods — an endpoint that makes it fail every request while still passing its readiness probe, which is the whole point of that experiment and the reason outlier detection exists. Then I applied a DestinationRule with outlierDetection, watched the waypoint eject the bad host, got my clean numbers, and — tidily, sensibly, disastrously — deleted the DestinationRule.
The pod was still poisoned. Ejection is a routing decision, not a repair. The moment the rule that was ejecting it went away, the broken pod walked straight back into the load-balancing pool — one of three, failing roughly a third of everything that reached it. And every fault-injection measurement I took after that was measuring two independent failure sources multiplied together.
The arithmetic fits to the point of embarrassment:
1 - (0.5 x 0.67) = 66%      observed: 70%
1 - (0.8 x 0.67) = 46%      observed: 44%
A request survives only if the injection lets it through and it lands on a healthy pod. Half of 0.67 is 0.33, so two thirds of requests fail — which is what I measured, and which I very nearly published as “Istio’s fault injection percentage is not what it claims to be.”
The fix was one command. kubectl rollout restart on catalog, replacing the poisoned pod with a clean one. Then, before touching the fault configuration at all, I did the thing I should have done in the first place and measured the baseline:
Clean baseline, no fault injected: 0 failures / 60 requests.Zero. And with a clean cluster underneath it, the feature snapped to spec:
percentage 50 -> aborted  95 / 200 = 47%
percentage 20 -> aborted  43 / 200 = 21%
It does exactly what it says. It always did.
Three rules come out of that, and I would rather you take these than anything else in the chapter.
Establish a baseline before you measure a change. Sixty requests with nothing configured takes ten seconds and would have caught this instantly — a baseline of “one in three requests fails” is not a baseline, it is a bug report. I skipped it because I knew the cluster was fine. I knew wrong.
Systematically wrong is not the same as noisily wrong — and the difference is itself the diagnosis. Noise is symmetric and it shrinks when you take more samples. My error was one-directional, present in both measurements, and consistent with a clean multiplicative model. When a number is wrong with structure, stop measuring and start looking for the second mechanism — because there is one. An error with structure was produced by something with structure.
A mesh measurement is only as clean as the cluster underneath it. Every number a mesh gives you is the composition of what the mesh did and what everything else in the path did — and the mesh does not know the difference. It cannot tell you that a third of your backends were poisoned by an experiment you ran an hour ago and forgot to clean up. It folds that into the total and hands you a percentage that looks like a fact.
Stale experiments are the single easiest way to publish a wrong number about a mesh. I nearly did, in a book, with the arithmetic sitting right there.
What the mesh cannot tell you
An honest flowchart has to include its own limits, so here are the three places where the tools above run out, all of which I hit.
Tracing did not work, and I did not solve it. The mesh injects x-b3-traceid and x-request-id into the request arriving at your pod — I watched it do so. An application that does not copy those headers onto its outbound calls produces disconnected single-span traces, which I also watched: twenty traces, a span-count distribution of {1: 20}, no tree, no parent, nothing. Then I added correct propagation to the bookshop’s Go code, restarted, re-ran — and got {1: 20} again. I have a hypothesis and no proof, and chapter six says exactly that. If your debugging strategy depends on a connected trace across ambient hops — test it on your own topology before you rely on it.
ext_authz I described but did not run (chapter nine). If you deploy a custom external authorizer and requests start failing, none of the tools above will tell you why — you will be debugging an RPC to a service you wrote, and the mesh will be an innocent bystander that happens to be holding the request.
Multicluster did not fit on the laptop. The east-west gateway pushed the remote cluster’s single node over its resource limits and istiod could not be scheduled — 0/1 nodes are available: 1 Insufficient cpu, 1 Insufficient memory. That is chapter ten, written as architecture described rather than architecture stood up — and it says so plainly.
Final thoughts
There is a version of this chapter that is a list of commands, and it would be less useful than what you have just read, because the commands are not the hard part. istioctl analyze is one line. Reading .status is one line. The hard part is knowing that the thing in front of you — a green pod, a healthy-looking policy row, a percentage that is off by twenty points — is not what it appears to be, and knowing which of the four systems in the path is the one lying to you.
And they are all lying, in the specific sense that they are each telling you the truth about a question you did not ask. Kubernetes tells you the pod is Ready, and it is — Ready is a claim about a probe, not about correctness. kubectl get tells you the policy exists, and it does — existence was never the question. Prometheus tells you there are no L7 metrics, and there aren’t — because there is no L7. Every one of those answers is accurate, and every one of them is an invitation to conclude something false.
What breaks the pattern is asking the system a question it can only answer one way. Does the policy have an enforcer — .status knows, and it is a boolean. Is the pod in the mesh — the workload table knows, and it either has a row or it does not. Is there a waypoint in this path — the service table knows, and so, silently, does the empty Grafana panel. Is my measurement clean — the baseline knows, and it cost sixty requests to find out.
The mesh is not mysterious. It is just newly present, in a path you have debugged for years without it, and it fails in dialects you have not learned yet. Learn the dialects. An L4 denial is a reset. An L7 denial is a 403. A 504 is a promise you made and forgot. And a 200 where you expected a refusal is the mesh telling you, in the politest possible way, that the thing you wrote is not the thing that is running.
Comments