Orders Are Failing and Every Dashboard Is Green
One incident, assembled only from things this track actually ran — a Ready pod serving nothing, a policy enforcing nothing, a measurement that lied for twenty minutes, and an egress lockdown that quietly stopped locking. And then the end of three books.
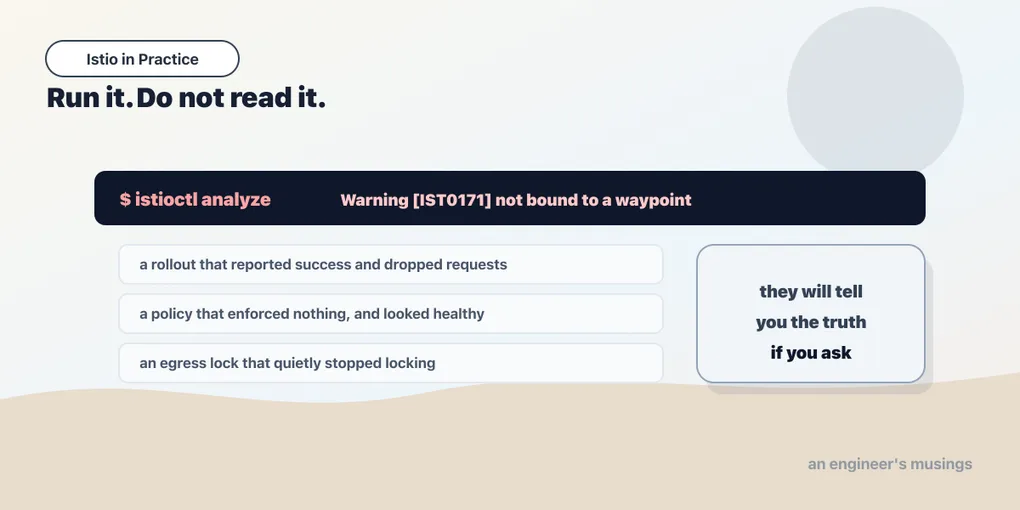
Orders are failing. Not all of them — roughly one in three, which is worse, because one in three means the thing still works and nobody can agree on whether there is a problem. Support has four tickets. The error budget is being eaten at a rate that will page someone properly in about an hour. And every surface you have says the system is fine: pods Running, pods Ready, restart counts at zero, the canary you shipped this morning sitting quietly at ten percent.
This is the last chapter of three books, and it is an incident — because an incident is the only honest exam. Everything below is assembled from things I actually ran on the lab cluster: every command, every status condition, every count, every percentage. The narrative is a reconstruction — I caused these failures at different moments, in a different order, and I have arranged them into the shape they would take on a Tuesday afternoon. Nothing is invented. Nothing is a screenshot of somebody else’s cluster. Where a number is real, it is real; where I did not run something, I say so.
Start where you always start, which is with the last thing that changed.
14:06 — the canary is the suspect, because the canary is always the suspect
The bookshop is mid-canary. web and web-canary behind a weighted split, ninety to ten, and this morning’s traffic through the Istio ingress gateway measured:
--- 100 requests through the 90/10 weighted split:
     7 <h1>CANARY BUILD
    93 <h1>The Bookshop (SUMMER SALE)
Ninety-three and seven against a ninety-ten split — which is exactly right, and worth two sentences of reassurance before anyone starts pointing at it. Weights are probabilistic, not quota. The mesh does not hold a counter and deal every tenth request to the canary; each request is an independent draw, and a hundred draws at p=0.1 lands somewhere in the seven-to-thirteen range about as often as not. Seven is not a bug and it is not drift. It is a coin.
So: is the canary serving the failures? Ten percent of traffic cannot produce a thirty percent failure rate, not even if every single canary request fails, and that arithmetic is your first real piece of evidence. But arithmetic is not attribution, and the way you attribute failures to a caller in a mesh is that you ask the mesh, because it has been counting since the day you enrolled the namespace and it never asked you for anything.
14:11 — the mesh has no idea, and that is a diagnosis
Query istio_requests_total for catalog, split by source workload and response code, and you get nothing useful. Not a broken query, not an empty time range — no L7 series at all for that Service. What ztunnel emits is istio_tcp_connections_opened_total, attributed by workload identity, and it is genuinely interesting data — which service opened how many connections to which other service, with cryptographic identity attached, for free, without anybody instrumenting anything. It is also, for this incident, useless. Bytes and connections do not have status codes.
We established the rule in the last chapter and here is the moment it earns its keep:
If a Service has no L7 metrics, that is a fact about your mesh, not a gap in your monitoring. There is no waypoint in that Service’s path.
Response codes come from the waypoint Envoy, which parses HTTP. ztunnel does not parse HTTP — it terminates mTLS, carries identity, and forwards bytes, and that was chapter six of the foundations. No waypoint, no HTTP, no codes.
Which means, eleven minutes into an incident, you have learned something considerably larger than you were looking for. The bookshop namespace has no L7 layer at all. No response-code metrics. No method-based policy that could be enforcing. No timeouts. No retries. No outlier detection. Every L7 capability this book spent thirteen chapters on is, right now, unbought — and nobody knew, because the absence of an L7 feature does not produce an error. It produces silence, and silence looks exactly like everything being fine.
Note it. Keep going.
14:19 — Kubernetes says the pods are perfect
catalog-6c4f598bdb-48wb4  READY=1/1  Running
catalog-6c4f598bdb-ftbgd  READY=1/1  Running
catalog-6c4f598bdb-jxpmc  READY=1/1  Running
Three pods. All Running. All 1/1. All Ready, all in the Service, all in the EndpointSlice, zero restarts. And a curl loop through the Service says:
30 requests: 20 x 200, 10 x 500Twenty and ten. One in three. Look at that ratio and then look at the pod count, because the ratio is the diagnosis: three backends, traffic spread roughly evenly across them, and a third of requests failing means one backend is failing everything it is given. Not a rate — a fraction. If a dependency were flaky you would see a rate; a rate does not land on a clean third and stay there.
(“Roughly evenly” is doing real work in that sentence, and the Services chapter is why. Nothing here is round-robin — kube-proxy picks at random, and the waypoint’s own distribution across three catalog pods measured 11 / 7 / 12 over thirty requests. You are reading a ratio, not a quota. It is one in three because one backend in three is broken, not because anything promised you a third.)
So one of those three pods is serving nothing but 500s, and Kubernetes has it marked Ready, and Kubernetes is not wrong. This is the single most important idea in the health chapter and the reason the resilience chapter exists: a readiness probe is a pod’s opinion of itself. The process is up. The port is open. The handler returns 200 to /healthz because the handler for /healthz returns 200, and it will keep doing so while every other request in the pod fails, because nothing in the probe’s contract requires the pod to be correct — only to be willing.
Kubernetes will never remove that pod. There is no mechanism in Kubernetes that observes what a pod does to real requests and forms an opinion about it — the kubelet knows what the probe said, and it does not know what your users got.
That is the gap. And the mesh is the thing that fills it — except that in this namespace, as of eight minutes ago, the mesh has no L7 in the path, and every tool that could route around a bad host lives at L7.
14:27 — somebody hardens the mesh, and it does nothing
Meanwhile, a reasonable theory arrives from a reasonable engineer: something is writing to the catalog that should not be. A misbehaving client, a retry storm on a POST, an internal tool with a bad loop. The fix is obvious and correct, and it is written in ninety seconds — an AuthorizationPolicy that lets orders read the catalog and forbids it from modifying it. GET yes, POST and DELETE no.
$ kubectl apply -f catalog-l7.yaml
authorizationpolicy.security.istio.io/catalog-l7 created

$ kubectl get authorizationpolicy -n bookshop
NAME         ACTION   AGE
catalog-l7   ALLOW    29s
Created. ALLOW. Twenty-nine seconds old. It is in Git, it is in the incident channel, and somebody types “policy is in” — and moves on to the next thing.
Now try the exact operation the policy forbids, from the exact caller the policy names:
GET    /books  -> http=200
DELETE /books  -> http=200
POST   /books  -> http=200
The DELETE went through. The policy is not running. It is not permissive, it is not misconfigured, it is not too broad — it has no enforcer. It is an L7 rule, bound to a Service, and the only thing in ambient that can enforce an L7 rule bound to a Service is a waypoint, and there is no waypoint. So the policy sits in etcd, valid, well-formed, reviewed, referenced in the incident timeline, and inert. That is the eleventh chapter of the foundations, and it is the worst thing in the mesh, and the reason it is the worst thing is on the screen right now: kubectl get printed a healthy row.
It printed a healthy row because it prints exactly the columns the CRD’s author declared in additionalPrinterColumns — name, action, age — which is a mechanism we built by hand in the CRDs chapter. The health of an AuthorizationPolicy is not among its printed columns and never will be, so the command everyone types can never show it.
The object knows, though. The object has known since the moment it was created:
$ kubectl get authorizationpolicy catalog-l7 -n bookshop -o jsonpath='{.status}'
  {
      "conditions": [
          {
              "lastTransitionTime": "2026-07-14T02:52:07.824582232Z",
              "message": "Service bookshop/catalog is not bound to a waypoint",
              "observedGeneration": "1",
              "reason": "AncestorNotBound",
              "status": "False",
              "type": "WaypointAccepted"
          }
      ]
  }
And so does istioctl analyze, which would have said so in CI, before any of this:
$ istioctl analyze -n bookshop
Warning [IST0171] (AuthorizationPolicy bookshop/catalog-l7) A condition with a negative status is
present: type=WaypointAccepted, reason=AncestorNotBound, message=Service bookshop/catalog is not
bound to a waypoint.
Info [IST0118] (Service bookshop/postgres) Port name pg (port: 5432, targetPort: pg) doesn't follow
the naming convention of Istio port.
Service bookshop/catalog is not bound to a waypoint. In English, with a code you can grep for, sitting in a field nobody read. (And a free defect in our own manifests while it is there — the Postgres Service names its port pg, and Istio infers protocol from port names. I wrote that Service two books ago and never noticed.)
14:34 — one command buys the whole layer
$ istioctl waypoint apply -n bookshop --enroll-namespace --wait
  ✅ waypoint bookshop/waypoint applied
  ✅ waypoint bookshop/waypoint is ready!
  ✅ namespace bookshop labeled with "istio.io/use-waypoint: waypoint"
One pod. And three separate things become true at once, none of which required touching the application, the Deployment, or a single line of the policy that was already there.
The policy starts enforcing. Same object, never edited, same caller, same three requests:
GET    /books  -> http=200
DELETE /books  -> http=403
POST /books -> http=403- A real HTTP status, composed by a real Envoy that opened the request, read
DELETE, compared it againstmethods: ["GET"], and refused. The condition on the object flips with it —WaypointAccepted=True (Accepted)— andAncestorNotBoundis gone. Nothing about the policy changed. Something in the path can now read a method.
The metrics arrive. The same Prometheus query that returned nothing twenty minutes ago now returns the whole story:
$ sum(istio_requests_total{destination_service_name="catalog"}) by (source_workload,response_code,reporter)
  source=web                reporter=waypoint  code=200   requests=134
  source=orders             reporter=waypoint  code=200   requests=132
  source=orders             reporter=waypoint  code=500   requests=46
  source=web-canary         reporter=waypoint  code=200   requests=7
  source=orders             reporter=waypoint  code=403   requests=2
  source=bookshop-gw-istio  reporter=source    code=200   requests=1
  source=orders             reporter=waypoint  code=504   requests=1
Read the fourth row. web-canary: seven requests, all 200, zero failures. The canary — the thing everyone has been staring at for half an hour, the thing three people wanted to roll back at 14:09 — has not produced a single error. The 500s belong to orders calling catalog, which is precisely where the poisoned pod is, and the mesh could have told you that at 14:06 if anyone had bought the layer that counts.
The other rows are the session’s own ledger, and they are worth a glance because they show how completely the mesh sees you: the two 403s are the policy we just made real, thirty seconds ago. The 504 is a request something in the mesh timed out. The single row with reporter=source is the gateway. Everything that happens to traffic in this namespace lands in that table, attributed by workload, without anybody adding a metrics library or changing a line of Go — which was the whole argument of the foundations’ last chapter, and which is a great deal more persuasive at 14:34 on a bad day than it is in a design review.
And ejection becomes possible. Which is the next command.
14:41 — the mesh removes the pod Kubernetes will not
A DestinationRule with outlier detection: eject a host after three consecutive 5xx, check every five seconds, keep it out for sixty, and never eject more than half the pool.
outlierDetection:
  consecutive5xxErrors: 3
  interval: 5s
  baseEjectionTime: 60s
  maxEjectionPercent: 50
That last field is not decoration. It is the thing standing between “one bad pod is removed” and “a bad deploy ejects your entire fleet and you serve 503s to everyone” — outlier detection is a machine that removes backends, and a machine that removes backends needs a floor.
Give the waypoint a few seconds to notice, then run the same thirty-request loop that produced twenty-and-ten:
30 requests: 30 x 200, 0 x 500Thirty out of thirty. The customer-facing symptom is gone, four minutes after the waypoint went in.
Now be very careful about what just happened, because this is where an incident goes wrong in the other direction. The pod is still Running. Still Ready. Still in the EndpointSlice. Still poisoned. Kubernetes never removed it and never will. The waypoint noticed a host failing, took it out of the load-balancing pool, and stopped sending it traffic — and that is a routing decision, not a repair. Ejection is an anaesthetic with a sixty-second timer on it. Nothing has been fixed. The bad pod is still there, and if anything removes the rule that is ejecting it, it comes straight back into the pool.
Hold that sentence. It is about to cost twenty minutes.
14:52 — the measurement that lied
Somebody wants to quantify the customer impact for the incident review, and the obvious way to do it is the tool this book taught in chapter four: fault injection. A VirtualService with fault.abort makes the waypoint fail a configured share of requests without forwarding them, so you can characterise how the caller behaves at a known failure rate. Ask for 50%. Send two hundred requests. Expect about a hundred failures.
Meanwhile — and this is the part that will look obvious in the write-up and looked like good hygiene at the time — somebody else tidies up. We are not leaving a permanent ejection rule in production. The DestinationRule is deleted.
The measurements come back:
asked 50%  ->  measured 70% aborted
asked 20%  ->  measured 44% aborted
And twenty minutes evaporate. Because those numbers are not noise — two hundred requests at a true 50% has a standard deviation of about three and a half percentage points, and this is off by twenty. It is wrong in the same direction both times, by roughly the same multiplicative factor, which is the fingerprint of a mechanism rather than a fluctuation. So people start theorising about Istio — maybe the abort is applied per-retry, maybe the waypoint double-counts, maybe 1.30 changed the semantics and the docs have not caught up.
It is none of that. The moment the DestinationRule was deleted, the poisoned pod walked straight back into the pool, and every request now has to survive two independent failure sources: the injected abort, and a one-in-three chance of landing on a pod that fails everything.
1 - (0.5 x 0.67) = 66%      measured: 70%
1 - (0.8 x 0.67) = 46%      measured: 44%
The arithmetic fits to the point of embarrassment. And the way you find it is not by reading Istio’s source — it is by doing the thing nobody did at 14:52, which is measuring the baseline first. Turn the fault injection off entirely and send sixty requests through a system that should be perfect. If a third of them fail, you do not have a baseline. You have a bug report, and you have been measuring two things at once.
The fix, and the fix for the incident, are the same command:
kubectl rollout restart deployment/catalog -n bookshopA new pod replaces the poisoned one. And then, with a clean cluster underneath it:
Clean baseline, no fault injected: 0 failures / 60 requests.
percentage 50 -> aborted  95 / 200 = 47%
percentage 20 -> aborted  43 / 200 = 21%
Zero out of sixty. And the feature snaps to spec — 47% and 21%, exactly what was asked for, exactly what it always did. A mesh measurement is only as clean as the cluster underneath it, and a stale experiment is the easiest way in the world to publish a wrong number about a mesh. I know, because I nearly published this one.
16:20 — the sting, found in the postmortem
The incident is over. Somebody, going through the mesh config for the write-up, asks a question nobody has asked in a month: is our egress still locked down?
It is in the config. It has been in the config since before the migration:
$ kubectl get cm istio -n istio-system -o jsonpath='{.data.mesh}'
outboundTrafficPolicy:
  mode: REGISTRY_ONLY
REGISTRY_ONLY — the egress lockdown every Istio tutorial teaches. Nothing may leave the cluster except to hosts in the service registry. The setting is present, correct, unchanged, and green.
Then somebody curls an external host from a pod. From the one namespace still running sidecars, and from the bookshop, which moved to ambient last month:
SIDECAR pod  (ns legacy,   istio-injection=enabled)  -> http://example.com : 502  BLOCKED
AMBIENT pod  (ns bookshop, dataplane-mode=ambient)   -> http://example.com : 200  NOT BLOCKED
Same cluster. Same setting. Two answers.
outboundTrafficPolicy is enforced by the sidecar Envoy — it sits inside the pod, sees the outbound connection, and refuses a destination that is not in the registry, which is why the sidecar pod gets a 502: an Envoy answered. In ambient the path is pod to ztunnel to internet. ztunnel is an L4 proxy and does not implement outboundTrafficPolicy. The waypoint does not save you either, because a waypoint handles L7 for mesh Services, and example.com is not one — so the waypoint is not in that path at all.
The migration to ambient — which was cheap, which restarted nothing, which every measurement in the cost chapter says was the right call — silently opened the egress. No policy errored. No pod failed. No warning was printed. kubectl get showed a healthy mesh with the setting still sitting in the config, looking exactly as correct as it did the day it was written. That is chapter seven, and it is the single most dangerous thing I found in this book, and I found it by curling example.com from a pod, which takes ten seconds.
I verified the regression. I did not verify the remedies — a ServiceEntry allow-list, a dedicated egress gateway, a Kubernetes NetworkPolicy as the ambient-compatible control. Those are described in that chapter and flagged there as not run, and they are flagged here too, because the last thing this book should do on its way out is tell you something it did not check.
What the incident actually was
One pod in a bad internal state, Ready and useless, that Kubernetes was structurally incapable of noticing. A security control that had never once run. A measurement confounded by a leftover experiment. And, underneath all of it, a migration performed a month earlier that quietly changed which controls were real.
Not one of those was an Istio bug. Every component did exactly what it documents. The readiness probe reported what a readiness probe measures — nothing more was ever promised. The policy was accepted because it is a valid policy. The percentage was applied because it was asked for. The mesh config still contained REGISTRY_ONLY because nobody deleted it. Every system in the path told the truth about a question nobody was asking — and the incident lived entirely in the gap between the question asked and the question answered.
What three books were for
You started with an empty cluster and no idea what a pod was. You can now build the whole thing.
You can run an application on Kubernetes and know what each object is really for — why a Deployment is not a pod, why a Service is a load balancer that DNS lies about, why Ready is a promise about traffic and not about health, why a ConfigMap edit reaches a file and never reaches an environment variable. You can encrypt every connection between every service with mutual TLS, rotating 24-hour certificates, and per-service cryptographic identity, and you can do it by labelling a namespace, with zero pod restarts and zero code changes. You can write policy about who may call whom, and — where it is worth paying for — about what they may do when they get there. You can shift traffic by weight, route by header, time out a service that has never heard of timeouts, retry a flaky dependency without touching it, and eject a broken backend that Kubernetes still believes is perfectly healthy. You can see all of it in metrics from an application that was never instrumented. You can migrate a namespace off sidecars with traffic in flight — 220 requests, 220 successes, one trial, and I said so. And you can debug it, which is the part that actually makes you dangerous.
And there is a list of things that are still hard, which I would rather leave you with than a victory lap.
Tracing is not solved in ambient, and I could not solve it. The mesh injects the headers — I watched it. An app that drops them yields single-span garbage — I watched that too, twenty traces, {1: 20}. I then added correct propagation to the application and it still did not produce a connected trace. If distributed tracing is your reason for adopting a mesh, test it on your own topology before you commit, and do not take a marketing diagram for a result.
Multicluster is not a laptop feature. The east-west gateway would not schedule — 1 Insufficient cpu, 1 Insufficient memory — and I wrote that chapter as architecture described rather than architecture stood up, and said so. The failure taught something true: this is the point where a mesh stops being free.
L7 is a thing you buy, and forget to buy. A waypoint is 51Mi and a hop, and it is the enforcer for every method policy, every timeout, every retry, every ejection, and every response-code metric you have. Ambient’s bargain — L4 and identity everywhere for almost nothing, L7 where you name it — is a genuinely better bargain than a proxy in every pod. It also has a seam in it, and this whole chapter fell through that seam.
And the version you pin goes end-of-life in about six months. Istio supports two minor releases at a time. Whatever you install today is on a clock, upgrading is a thing you will do forever, and the revisions and tags mechanism is not an advanced topic — it is the maintenance plan.
Final thoughts
Go back through the three books and look at what actually cost money.
A rolling update that reported success while dropping requests — deployment "web" successfully rolled out, and a client watching from inside the cluster counting 000s. A DNS tool that returned NXDOMAIN for a name that resolved perfectly, so that nslookup catalog.bookshop said the name did not exist while curl http://catalog.bookshop/books returned the books, one second later, in the same shell. A ConfigMap edit that reached the mounted file and never reached the process, because a subPath mount is a bind that does not participate in the symlink flip, and because no power on Linux can change the environment of a running process. An AuthorizationPolicy that enforced nothing while printing a healthy row. An egress lockdown that stopped locking the day a namespace changed data planes, with the setting still sitting in the config, still spelled correctly.
Five failures across three technologies and there is exactly one thing wrong in all of them, and it is not a bug. In every case, a control was believed to be applied, and was not — and every single one of those systems would have told the truth if anybody had asked it. The rollout race shows up the instant you point a request loop at the Service during the rollout. The DNS lie dissolves the moment you stop believing nslookup and start believing curl. The stale env var is visible in one printenv. The dead policy is a .status field and an istioctl analyze warning with a code you can grep for. The open egress is one curl to example.com from inside a pod, and it takes ten seconds.
None of that requires cleverness. It requires doing it — sending the request, reading the field, running the command against the thing that is actually running, rather than reading the YAML and concluding that the YAML is what is happening. The YAML is a proposal. The cluster is the outcome. And the distance between the two is where every expensive afternoon of my career has been spent.
So that is the whole thesis of three books, and it is not really about Kubernetes and it is not really about Istio: the systems will tell you the truth if you ask them, and they will never volunteer it. They will not warn you. They will not go red. They will hand you a green row, a valid object, a plausible number, and a control that does nothing — and they will do it in perfect good faith, because you never asked the question that would have exposed it.
Ask. Run the command. Curl the thing. Measure the baseline before you measure the change.
Don’t read it. Run it.
Comments