It Spills Before It Fails
What actually happens at the memory limit — measured spill volumes, why a query that OOMs on 16 threads succeeds on 8, and how to read the error message that tells you it ran out of disk rather than RAM.
“Larger than memory” is the phrase every in-process database uses and almost none of them explain. It suggests a binary: your data fits and everything is fine, or it does not and something clever happens.
The reality is a gradient with several distinct failure modes, and they are worth telling apart. A query can spill quietly and cost you 13%. It can spill hard and cost you 2.5×. It can fail for want of memory, or for want of disk, and the two errors look nearly identical. And a query that fails outright can be made to succeed by giving it fewer threads, which is backwards from the intuition.
Everything here was run against DuckDB 1.5.5 on a 20-million-row Parquet file, on a machine with 32 GB of RAM and 16 threads.
The three settings
select current_setting('memory_limit');
select current_setting('temp_directory');
select current_setting('max_temp_directory_size');
25.5 GiB
.tmp
90% of available disk spacememory_limit defaults to about 80% of physical RAM. It is a budget DuckDB enforces on itself, not a hint. When a query would exceed it, DuckDB acts rather than letting the operating system decide.
temp_directory is where the spilled data goes. For an in-memory database it defaults to .tmp in the working directory. For a file-backed one it sits beside the database file. This is a real directory that will hold real gigabytes, and its default is wherever you happened to be standing.
max_temp_directory_size caps how much can land there. The default is generous and phrased relative to free space, so it moves as the disk fills.
Setting the limit is one statement, and it is honest about rounding:
set memory_limit = '100MB';
select current_setting('memory_limit');
95.4 MiBMegabytes in, mebibytes out.
What spilling actually costs
Take a sort of 20 million rows and run it at three limits, watching the temp directory while the query runs:
select count(*) from (select * from 'big/hits.parquet' order by bytes) t;limit=16GB 217 ms peak spill 0.0 MB
limit=300MB 181 ms peak spill 0.0 MB
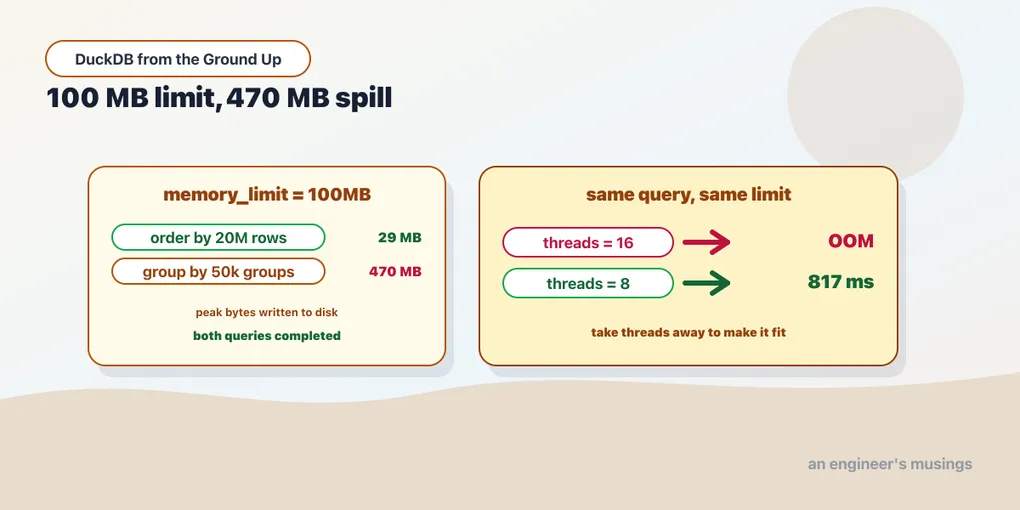
limit=100MB 246 ms peak spill 28.8 MBAt 300 MB it still fits, and the query is no slower than with 16 GB available. Giving DuckDB more memory than it needs buys nothing. At 100 MB it spills, and the cost is 246 ms against 217. Thirteen percent for running the same sort in a sixtieth of the memory.
Now the same exercise with a grouped aggregate. 50,000 distinct groups means a hash table that has to be partitioned, rather than a run that can be merged:
select count(*) from (select user_id, count(*) from 'big/hits.parquet' group by 1) t;limit=16GB 354 ms peak spill 0.0 MB
limit=300MB 627 ms peak spill 0.0 MB
limit=100MB 879 ms peak spill 469.6 MBTwo and a half times slower, and note the number that matters most: the peak spill was 469.6 MB against a 100 MB memory limit. Nearly five times.
That is the practical warning in this chapter. Setting memory_limit='4GB' because your container has 4 GB does not bound what hits the disk. The spill is not a copy of your working set. It is the working set plus partitioning overhead, written out in blocks. Point temp_directory at a small volume, a container layer, or a network mount, and you have moved the constraint rather than removed it.
Both of these queries completed. Nothing failed, nothing was truncated, and no configuration changed beyond the limit. That is the headline. At the boundary DuckDB degrades, and the degradation is gentler than the folklore suggests.
The finding that inverts the intuition
Same aggregate, same 100 MB limit, varying only the thread count:
threads=16   OOM
threads=8       817 ms
threads=4       960 ms
threads=2       494 ms
threads=1       940 ms
Sixteen threads fails. Eight threads succeeds. Nothing else changed.
The reason is that memory_limit is a budget for the whole database, but the pressure consuming it is per-thread. Each thread building its share of a hash table needs a working set of its own, and DuckDB will not shrink that below a floor. Sixteen threads times that floor exceeds 95 MiB; eight threads times it does not. More parallelism means more simultaneous working sets, and under a tight limit that is what breaks you.
Push it further and the picture is stark. At one thread, the same 20-million-row aggregate over 50,000 groups completes at a 20 MB memory limit, in 905 ms.
Twenty megabytes. Twenty million rows. That is the “larger than memory” claim actually delivered. The knob that delivered it is the one that sounds like it should make things worse.
The tradeoff is what you would expect. Fewer threads means less parallelism, which means slower on a machine that is not memory-constrained. The 494 ms at two threads against 940 ms at one is real, and so is the 354 ms at 16 threads with a roomy limit. This is a knob for the constrained case, not a default to adopt.
Reading the error
When it does fail, DuckDB tells you a lot. The message is worth reading closely rather than skimming for the word “memory”:
Out of Memory Error: could not allocate block of size 256.0 KiB (95.5 MiB/95.3 MiB used)

Possible solutions:
* Reducing the number of threads (SET threads=X)
* Disabling insertion-order preservation (SET preserve_insertion_order=false)
* Increasing the memory limit (SET memory_limit='...GB')
Three suggestions, and they are not equally useful in practice.
Reducing threads works, as the previous section measured. This is the first suggestion and it earns the position.
Disabling insertion-order preservation did nothing in my tests. preserve_insertion_order defaults to true, and toggling it changed neither the outcome nor the timing at any limit near the edge. At 120 MB and at 100 MB with 16 threads, the sort failed with it on and failed with it off. It presumably helps some workloads. It did not help these, and it is not the first thing to reach for.
Increasing the limit always works and is usually not available, which is why you are reading the message.
Two failures that are not what they say
The interesting part is that “Out of Memory Error” covers more than one condition. Turn spilling off entirely:
set temp_directory = '';Out of Memory Error: failed to allocate data of size 2.0 MiB (94.3 MiB/95.3 MiB used)That is a genuine memory failure, and the numbers in the parentheses are memory numbers matching memory_limit.
Now put spilling back and cap the temp directory instead:
set temp_directory = 'spill';
set max_temp_directory_size = '10MB';
Out of Memory Error: failed to offload data block of size 256.0 KiB (9.3 MiB/9.5 MiB used)Still “Out of Memory Error”, but read what it says. The verb is offload, not allocate. And the numbers are 9.3 of 9.5 MiB — nothing to do with the 95 MiB memory limit, everything to do with the 10 MB disk cap.
The tell is that the numbers do not match your memory_limit. When an OOM error quotes a figure you do not recognise, the query is out of spill space rather than out of RAM. Adding memory will not fix it. Give the temp directory somewhere to go, or raise its cap.
That distinction is worth more than it looks, because the two problems have opposite fixes and both errors begin with the same three words. It is also the failure mode most likely to hit you in production rather than on a laptop. A container with a small writable layer is exactly where the disk budget binds first.
What this means for how you work
Do not set memory_limit to your container’s full allocation. DuckDB will use what you give it, and your process needs headroom for everything else. Leaving 20–25% is the usual shape, and it is what the default already does.
Put temp_directory somewhere you chose. The default is the working directory, which on a scheduled job is wherever the runner happened to start. Point it at a volume with room. Size that volume against the spill numbers above, not against your memory limit: several times the limit is a realistic peak.
Reach for threads before you reach for more memory. It is the one suggestion in the error message that measurably changed the outcome here. On a constrained box it is usually the only one available.
Expect the aggregate to hurt more than the sort. A sort spills sequential runs and merges them, which disks are good at. A hash aggregate spills partitions and re-reads them, which is more work and more data. The 13%-versus-2.5× gap above is the shape of that difference. It means “will this spill” is a less useful question than “what will spill.”
The honest limit of all this: 20 million rows on a 32 GB machine is not a stress test, and every number here is from local SSD. The mechanics are the same at a larger scale. But a spill to network storage is a different animal, and the ratios above would not survive it.
Final thoughts
The phrase “larger than memory” turns out to describe a set of behaviours rather than a feature. Sorts spill cheaply and aggregates spill expensively. Both keep working well past the point where the naive expectation is a crash: a 20-million-row group-by finished inside a 20 MB budget.
Two things are worth keeping. First, the spill file can be several times the memory limit, so the disk is a resource you size on purpose rather than discover. Second, an “Out of Memory Error” whose numbers you do not recognise is a disk error wearing the wrong label, and the fix lives in a different setting entirely.
And the counterintuitive one: when a query will not fit, take threads away from it.
Next: Nothing Is Bundled — what ships in the binary, what downloads on first use, and the failure that looks like a missing function but is a missing network.
Comments