Flying With Instruments: Logging and Metrics
When production misbehaves, you need to see inside. Add request logging, trace a single request across log lines with a call ID, and expose Prometheus metrics — all as plugins.
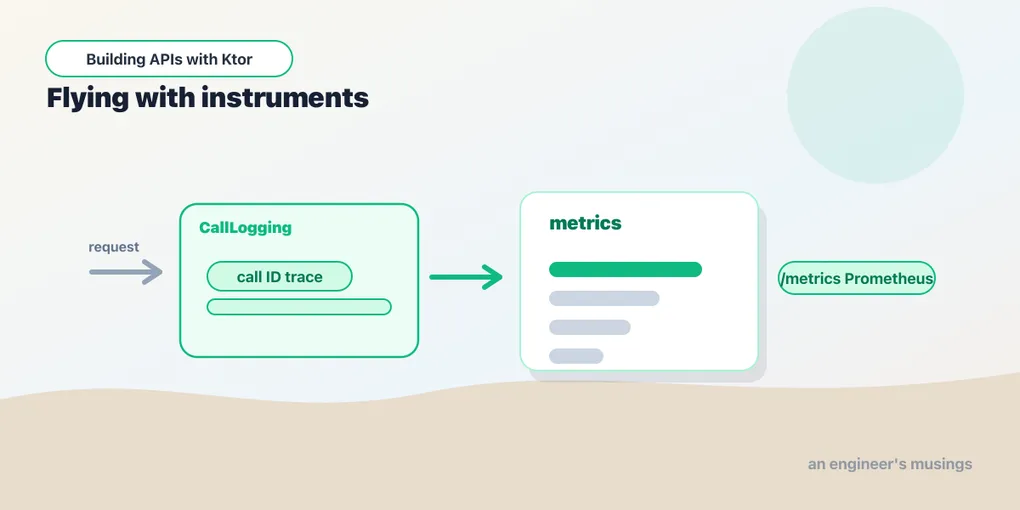
A service you can’t see into is a service you can’t operate. When the 500s start at 3am, “it’s slow sometimes” isn’t a diagnosis — you need logs that say what happened and metrics that say how often. Ktor’s observability is, predictably, a few plugins.
Request logging
The CallLogging plugin logs every request — method, path, status, duration:
implementation("io.ktor:ktor-server-call-logging")import io.ktor.server.plugins.calllogging.*
import org.slf4j.event.Level
fun Application.configureMonitoring() {
install(CallLogging) {
level = Level.INFO
filter { call -> call.request.path().startsWith("/") }
}
}filter { } lets you skip noise — exclude health-check pings or static assets so they don’t drown the log. Out of the box you now get a line per request, which is often all you need to answer “did that request even reach us, and what did we send back?”
Logging output is governed by logback.xml (the generator created one). A reasonable console pattern:
<appender name="STDOUT" class="ch.qos.logback.core.ConsoleAppender">
    <encoder>
        <pattern>%d{HH:mm:ss} %-5level [%X{call-id}] %logger{20} - %msg%n</pattern>
    </encoder>
</appender>
That %X{call-id} is a placeholder for the next piece.
Tracing one request: the call ID
In production, dozens of requests interleave in the log. To follow one request across all the lines it produced, give each a call ID. The CallId plugin assigns one (or reads it from a header an upstream proxy set), and CallLogging can stamp it into every log line via MDC:
import io.ktor.server.plugins.callid.*
import java.util.UUID

install(CallId) {
    header(HttpHeaders.XRequestId)          // reuse an incoming X-Request-Id if present
    generate { UUID.randomUUID().toString() } // otherwise mint one
    verify { it.isNotEmpty() }
}

install(CallLogging) {
    level = Level.INFO
    callIdMdc("call-id")                    // put the id in the MDC as "call-id"
}
Now every log line for a request carries the same id (that [%X{call-id}] in the pattern), so you can grep one request’s entire journey out of a million lines. Reusing an inbound X-Request-Id means the id can follow a request across services — the foundation of distributed tracing.
Logging from your own code
Ktor gives every application an SLF4J logger at application.log, and you can create named loggers anywhere:
import org.slf4j.LoggerFactory

private val logger = LoggerFactory.getLogger("TaskService")

class TaskService(private val repo: TaskRepository) {
    suspend fun create(draft: NewTask): Task {
        val task = repo.create(draft)
        logger.info("Created task {}", task.id)   // {} placeholder, no string building
        return task
    }
}
Use {} placeholders rather than string concatenation — the arguments are only formatted if that level is actually enabled, so debug logging costs nothing in production. And recall the rule from the error-handling post: log the full exception server-side, return something generic to the client.
Metrics with Micrometer
Logs tell you about individual requests; metrics tell you about aggregates — request rate, latency percentiles, error counts. The MicrometerMetrics plugin exposes them, and Micrometer can feed Prometheus:
implementation("io.ktor:ktor-server-metrics-micrometer")
implementation("io.micrometer:micrometer-registry-prometheus:1.14.2")
import io.ktor.server.metrics.micrometer.*
import io.micrometer.prometheusmetrics.*
val prometheusRegistry = PrometheusMeterRegistry(PrometheusConfig.DEFAULT)
fun Application.configureMetrics() {
install(MicrometerMetrics) {
registry = prometheusRegistry
}
routing {
get("/metrics") {
call.respondText(prometheusRegistry.scrape())
}
}
}The plugin automatically tracks per-route request counts, durations, and active requests. A Prometheus server scrapes /metrics on a schedule, and you build dashboards and alerts on top — “alert if p99 latency on /tasks exceeds 500ms,” that sort of thing. (In a real deployment you’d protect or firewall /metrics so it isn’t public.)
A health check
The humblest, most useful endpoint: a liveness check for load balancers and orchestrators to poll.
routing {
    get("/health") {
        call.respond(HttpStatusCode.OK, mapOf("status" to "UP"))
    }
}
Keep it cheap and dependency-light — its job is to answer “is this process alive and serving?” quickly. We’ll point Docker and the deployment at it in the final post.
Final thoughts
Observability is three questions and a plugin for each: what is each request doing? (CallLogging), which lines belong to the same request? (CallId), and how is the system behaving in aggregate? (Micrometer). Wire them early, while it’s a one-line install, not during an incident. The call ID in particular is the cheapest thing you’ll ever add that pays for itself the first time you have to untangle one failing request from the firehose.
Next: the Ktor client — your service rarely lives alone, so let’s call other services and APIs.
Comments