The Rule Was Right, the List Was Wrong
A table-health pack of eighteen metrics derived from metadata, run against forty-three tables in forty-four seconds, and seven alert rules scored against what the lab had actually done to each table. Three of the pack's own queries were wrong before any rule was, and the rule that inferred a streaming table from its cadence fired on six batch tables.
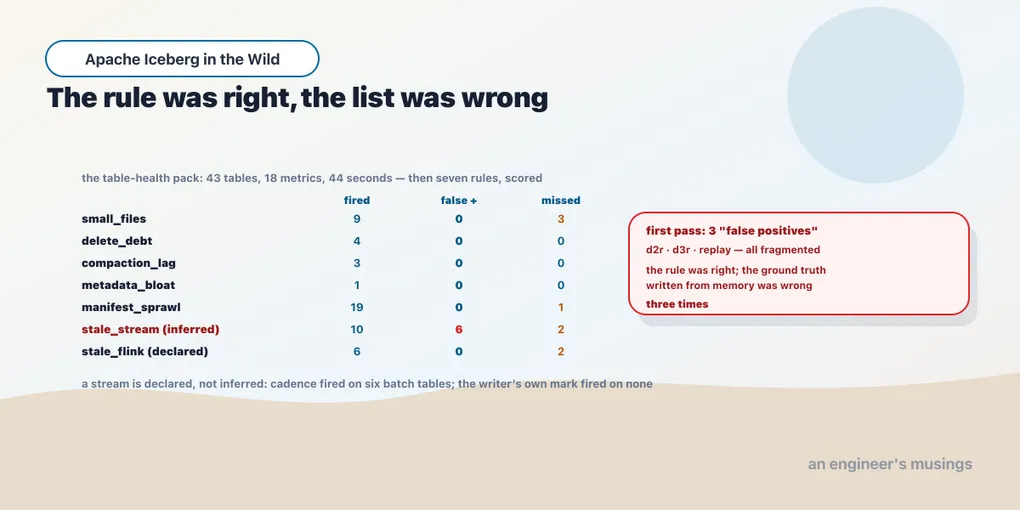
A rule for small files, excess_files > 20 AND median_file_kb < 32768, run against every table the lab had built in the previous six chapters. Then scored against a list of the tables the author knew to be fragmented.
  small_files    fired on 9
                 false positives 3: [stage11.d2r, stage11.d3r, stage14.replay]   missed 0
The first pass appeared to have three false positives. Looking at the files changed the diagnosis: a v2 and a v3 table each had fifty-nine files over thirty partitions at a median of 58 KB. The Flink table had thirty-seven files at 6 KB each. All three were fragmented. The rule was right; the list — written from memory of what each chapter had done — was wrong. The same mistake appeared in the expected results for the delete and manifest rules. Scoring an alert against ground truth is how you find out that the ground truth is the thing that needs work. That is the first finding of a chapter on observability. The metrics are cheap, and the hard part is knowing what they should say.
The health pack below collects eighteen metrics per table using metadata queries plus one request to the catalog. These are the metadata tables introduced in Book 1’s chapter 9 and used here since chapter 7. Seven alert rules turn the measurements into possible work. Their misses matter as much as their successes: a rule should help someone decide what to do, and the wrong diagnosis sends them to the wrong job.
The pack
| Metric | Source | Owner |
|---|---|---|
| snapshots; snapshots since the last data compaction | snapshots, with summary['deleted-data-files'] > 0 to tell a compaction from a manifest rewrite | ch8, ch10 |
| files; partitions; files beyond one per partition | data_files, partitions | ch7, ch8 |
| median file size | data_files.file_size_in_bytes | ch8 |
| delete files; delete rows per data file | delete_files | ch8, ch11 |
| manifests | manifests | ch9 |
| metadata file size; metadata-log entries | metadata_log_entries, plus one HEAD on the store | ch9 |
| references | refs | ch10 |
| last commit; freshness | snapshots.committed_at | ch11, ch12 |
| commit cadence, median and p95 gap | lag() over snapshots.committed_at | ch11 |
| written by Flink | summary['flink.job-id'] on the latest snapshot | ch11 |
| load-table payload and latency | one GET on the catalog | ch9 |
-- the four the rules lean on hardest
SELECT count(*) FROM t.snapshots
 WHERE committed_at > coalesce((SELECT max(committed_at) FROM t.snapshots
                                 WHERE operation = 'replace'
                                   AND CAST(summary['deleted-data-files'] AS INT) > 0), timestamp '1970-01-01');
SELECT count(*) - (SELECT count(*) FROM t.partitions) FROM t.data_files;
SELECT coalesce(sum(record_count), 0) / greatest((SELECT count(*) FROM t.data_files), 1) FROM t.delete_files;
SELECT percentile_approx(gap, 0.5) FROM (SELECT unix_timestamp(committed_at)
        - unix_timestamp(lag(committed_at) OVER (ORDER BY committed_at)) AS gap FROM t.snapshots) WHERE gap IS NOT NULL;
43 tables in 44s (1.0s per table, 18 metrics each)The pack took a second per table for nineteen small queries, without opening a data file. It still pays for planning: each query reads manifests and metadata, repeating chapter 9’s planning cost nineteen times per table. A large load-table response adds to that cost on every query — the catalog measurement therefore helps account for the pack’s own load as well as the engines’. At this rate, a thousand tables take seventeen minutes on one Spark session. That suits an hourly pass. Freshness needs a per-minute check, so its single query runs separately; the remaining metrics follow the maintenance schedule.
The pack’s own defects, found by running it
Three of the queries were wrong on the first pass, and each one is a class of mistake a health pack makes.
The partition column does not exist on an unpartitioned table. count(DISTINCT partition) over data_files failed on every Flink table and every CDC table — silently. The pack reported their partition count as zero and their excess files as all of them. The partitions metadata table has one row for an unpartitioned table, so counting it is the query that works on both.
A rule that fires on everything is a units bug or a guessed threshold. The load-table payload came back in bytes and was compared against a threshold written in kilobytes, so metadata_bloat fired on all forty-three tables. Fixed, and with the threshold set from the fleet’s own distribution, median 78 KB, ninetieth percentile 160 KB, it fired on exactly the one table with six hundred snapshots.
replace is two different operations. The snapshot log records a data compaction and a manifest rewrite with the same operation name. “Snapshots since the last compaction” counted from whichever came last, and a table whose manifests had just been rewritten looked freshly compacted. The summary tells them apart — a compaction has deleted-data-files, a manifest rewrite does not.
And one blind spot that is not a defect but has to be known: the count of snapshots since compaction is bounded by retention. Chapter 10’s hot-class tables keep two snapshots, so their compaction lag reads two whatever happened, and the six-hundred-commit table read ten after its expiry. On a table with aggressive retention the lag metric measures the retention window — and files beyond one per partition is the metric that measures the table.
The fleet, as the pack saw it
A selection of the forty-three rows, chosen to show each metric doing its job.
| Table | snapshots | since compaction | files | partitions | excess | p50 KB | delete files | del/file | manifests | metadata KB | load KB |
|---|---|---|---|---|---|---|---|---|---|---|---|
stage12.m_after (ch9, 600 commits) | 601 | 601 | 600 | 30 | 570 | 2 | 0 | 0 | 1 | 559 | 560 |
stage12.m_before (ch9, expired) | 10 | 10 | 601 | 30 | 571 | 2 | 0 | 0 | 7 | 12 | 12 |
stage11.stream (ch8, uncompacted) | 150 | 150 | 150 | 30 | 120 | 58 | 0 | 0 | 51 | 151 | 151 |
stage11.c1 (ch8, the lost race) | 151 | 151 | 146 | 30 | 116 | 219 | 0 | 0 | 52 | 152 | 152 |
stage11.s_binpack (ch8, compacted) | 151 | 0 | 30 | 30 | 0 | 275 | 0 | 0 | 52 | 153 | 153 |
stage10.orders_hourly (ch7) | 10 | 10 | 936 | 720 | 216 | 16 | 0 | 0 | 10 | 12 | 12 |
stage11.d2 (ch8, v2 deletes) | 71 | 0 | 30 | 30 | 0 | 109 | 60 | 2,000 | 62 | 77 | 77 |
stage15.orders_replay (ch12) | 1 | 1 | 1 | 1 | 0 | 347 | 2 | 61,182 | 2 | 2 | 3 |
stage14.events (ch11, Flink) | 10 | 5 | 15 | 3 | 12 | 7 | 0 | 0 | 4 | 15 | 15 |
stage15.orders_cdc (ch12, rewritten) | 8 | 0 | 1 | 1 | 0 | 342 | 0 | 0 | 11 | 11 | 11 |
Two rows are worth a second look. The compacted s_binpack has thirty files, zero excess, and fifty-two manifests. Chapter 8’s compaction rewrote its data files and never its manifests, and that is the row that made the manifest rule’s ground truth wrong. A compaction leaves every manifest it touched in place with its entries marked deleted, and only chapter 9’s rewrite folds them; the pack sees the difference and the author had forgotten it. And orders_replay has one data file and two delete files holding sixty-one thousand delete rows against it. That is chapter 12’s landing table before its rewrite, and the highest delete ratio in the fleet by a factor of thirty.
Seven rules, scored
Each rule was run against the forty-three rows, and its firings compared with the list of tables the chapters’ records say should fire. The list was corrected where the rule proved it wrong; the misses that remain are the rule’s.
| Rule | Fired | False positives | Missed | What the misses are |
|---|---|---|---|---|
small_files: excess > 20 and p50 < 32 MB | 9 | 0 | 3 | three Flink tables with 11–19 tiny files: under the excess threshold, which was set for batch fleets |
delete_debt: del/file > 100 or delete files > 10 | 4 | 0 | 0 | |
compaction_lag: since compaction > 50 | 3 | 0 | 0 | after the deleted-data-files fix; before it, the 600-commit table read zero |
metadata_bloat: metadata > 256 KB | 1 | 0 | 0 | after the units fix; before it, 43 |
manifest_sprawl: manifests > 20 | 19 | 0 | 1 | one table at exactly 20; a threshold is an edge and something sits on it |
stale_stream: cadence median < 30 s and fresh > 5 min | 10 | 6 | 2 | inferred from cadence: fired on batch tables written in bursts, on bounded jobs that finished, on a table merged twice five seconds apart; missed two tables with one snapshot |
stale_flink: last snapshot carries flink.job-id and fresh > 5 min | 6 | 0 | 2 | declared by the writer: missed the two upsert tables whose latest snapshot was a Spark rewrite |
The two freshness rules expose a problem that fixing the queries cannot solve. Both try to recognise a streaming table from its recent commits. Their different mistakes show why the pack needs to be told which tables are streams.
A stream is declared, not inferred
Whether a table is supposed to be receiving commits every few seconds is not a property of the table’s metadata. The cadence rule tried to infer it from the gaps between commits and was wrong six times in ten. A batch table loaded in ten quick inserts has a median gap of one second and looks like a stream that stopped. A bounded Flink job that finished looks the same. A table merged twice in one session looks the same. The summary rule looked for the writer’s own mark — the flink.job-id chapter 11 found on every commit a Flink job makes — and had no false positives. It missed the two tables whose latest commit was a Spark maintenance rewrite, which carries no such key. The mark is per snapshot, and the last snapshot is not always the writer’s.
The class of a table is a table property, set when the table is created, and the pack reads it. bookshop.class = stream on the events table, cdc-landing on the orders landing table, batch on the rest. Then the stale rule is class = stream AND freshness > 5 min and it has nothing to infer. The writer’s mark in the summary remains useful as the audit that the declared writer is the actual one, read over the last several snapshots rather than the last.
Symptoms and actions
The seven rules map onto the chapters that own the fix, and one of them does not map onto a table at all.
| Rule fires | The action | Where |
|---|---|---|
small_files | data-file rewrite, scoped by the partitions still being written | ch8 |
delete_debt | data-file rewrite with delete-file-threshold | ch8, ch11 |
compaction_lag | schedule the compaction that is not running | ch8 |
metadata_bloat | expire snapshots; set delete-after-commit | ch9, ch10 |
manifest_sprawl | rewrite_manifests, after the compaction that left them | ch9 |
| stale stream | nothing on the table: check the job | ch11 |
The stale stream is a symptom. The table is fine; the writer has stopped, and the runbook entry is chapter 11’s, not a maintenance procedure. A dashboard that puts it beside the maintenance rules invites someone to run a compaction on a table whose problem is a dead Flink job. A rule is actionable when its action is on the object it measured. The rest are symptoms, and symptoms belong on the writer’s dashboard — with chapter 11’s checkpoint counts and chapter 12’s convergence time — not on the table’s.
What the pack does not measure
Four operational metrics need sources outside the metadata tables, so they belong in a second pack. Commit success and latency are the writer’s: Flink’s checkpoint counts and durations from chapter 11’s REST calls, and for batch writers the job scheduler’s exit codes. Planning latency is chapter 9’s probe, requests under metadata/ counted at the proxy. Freshness for change data is the checkpoint interval plus the source connector’s lag, and Debezium’s lag is not in Iceberg. Cost per table is chapter 2’s request table applied to the per-table request counts the proxy produces, and chapter 18 assembles it. Each of those has a source; none of them is the table’s metadata, and a pack that only reads metadata has to say so on its dashboard.
The dashboard schema
One row per table per run of the pack, which is the health table itself, stored as an Iceberg table so that its own history is queryable.
CREATE TABLE ops.table_health (
  run_at TIMESTAMP, catalog STRING, tbl STRING, class STRING,
  snapshots INT, since_compaction INT, files INT, partitions INT, excess_files INT,
  median_file_kb DOUBLE, delete_files INT, deletes_per_file DOUBLE, manifests INT,
  refs INT, last_commit TIMESTAMP, freshness_min DOUBLE, gap_p50_s DOUBLE, gap_p95_s DOUBLE,
  metadata_kb DOUBLE, load_kb DOUBLE, load_ms DOUBLE, flink_written BOOLEAN
) USING iceberg PARTITIONED BY (days(run_at));
The rules are views over it, one per row of the scoring table, filtered by class. The false-positive rate of each rule is then a query too: rule firings joined against the maintenance log, over as much history as the health table has. This lab has hours of history and forty-three tables. The rates above are one instant across a fleet — not a week across time. The lab could not yet supply the week of history needed for that longer view.
What to decide
Declare the class at creation, as a table property every rule reads. The batch bursts and maintenance commits above show why recent history alone cannot reliably tell the pack whether a stream has stopped.
Score every rule before it pages anyone, against a list, and expect the list to be wrong first. The list is corrected from the rows; the rule is corrected from the list.
Set thresholds from the fleet’s distribution — never from a guess — and re-derive them when the fleet changes. A rule that fires on everything has a bug, and a threshold is an edge that something will sit on.
Split the dashboard by who acts. Table rules for the maintenance jobs. Writer rules for the job owners. A symptom on the wrong dashboard is a compaction run against a dead writer.
Store the health results in a table. Joining past firings to the maintenance log then lets you query the rules’ accuracy instead of judging each alert in isolation.
What was not run
A week of history: the rates are one pass over forty-three tables. Debezium’s own lag, which is the change-data freshness the pack cannot see. The query log, which is where chapter 7’s predicate skew lives and which no metadata table records. And alert fatigue over time, which is the number that decides whether anyone still reads the dashboard in a month.
Exercises
1. Find your fleet’s thresholds. Run the pack once and compute the median, ninetieth and ninety-ninth percentile of excess_files, deletes_per_file, manifests and metadata_kb across every table. Set each rule’s threshold at the ninetieth percentile and count the firings; then at the ninety-ninth.
Show answer
At the ninetieth percentile a tenth of the fleet fires on every run, which is the pool the maintenance budget can reach. At the ninety-ninth only the outliers fire, which is a page. The two thresholds are two different rules, a work queue and an alarm, and both should exist.
2. Catch the manifest rewrite. On a table that has been compacted, run rewrite_manifests and then the naive “since last replace” query and the corrected one. Then run a compaction and repeat.
Show answer
After the manifest rewrite the naive count resets to zero and the corrected one does not, because the rewrite’s summary has no deleted-data-files. After the compaction both reset. A dashboard on the naive query shows a table as freshly compacted every time its manifests are tidied.
Final thoughts
Every number on the dashboard came from a metadata table and cost a second per table to produce. The only expensive part of the chapter was finding out which numbers to trust. Three of the pack’s queries were wrong, and the fleet said so. The ground truth was wrong three times, and the rules said so. The rule that inferred what a table was for was wrong six times in ten — and the fix was to stop inferring.
A metadata dashboard can still look healthy when the objects it describes are missing. The next chapter starts with that failure, then works through the incidents produced in the lab, keeping the evidence from triage through recovery.
Comments