The Semantic Layer Is Where Metrics Stop Wandering
A practical orientation to dbt's semantic layer, MetricFlow, semantic models, entities, measures, dimensions, and when a team actually needs them.
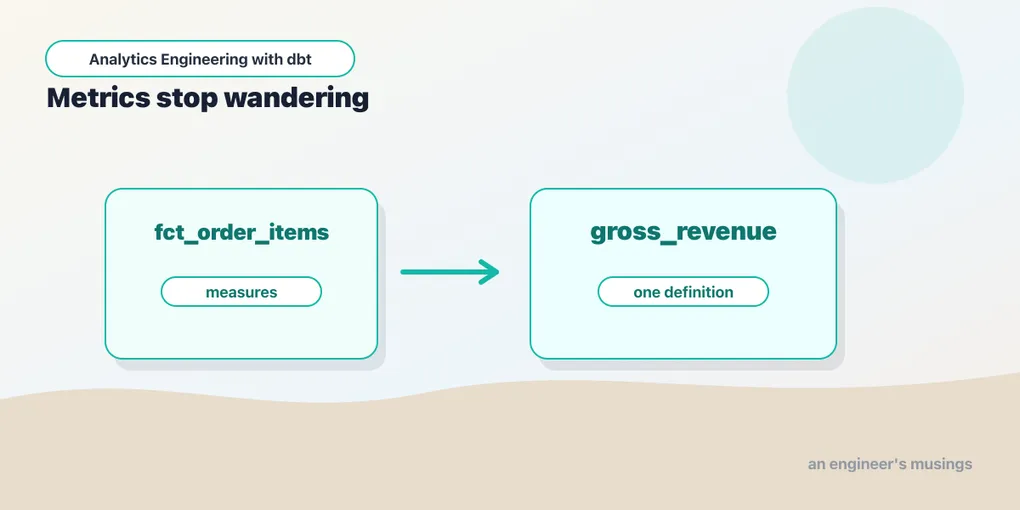
Every company eventually has two revenue numbers. Then three. Then a spreadsheet called Revenue Definition FINAL, which is how you know the fourth number has already won.
The problem is not that analysts are careless. The problem is that a table is not a metric definition. Our orders mart exposes amount, status, and order_date, but it does not force every downstream tool to calculate “revenue” the same way, at the same grain, with the same time dimension, and the same filters.
Here is how it goes wrong in practice. The finance dashboard computes revenue as sum(amount) over every order, because that is the number that ties to what was billed. The growth team excludes cancelled and returned orders, because they care about what actually stuck. Someone in the BI tool builds a “revenue” measure that also drops placed orders that never shipped, because their VP asked “why does this not match the bank?” Now three dashboards all say “revenue” and all disagree, and every one of them is defensible. The SQL is not wrong anywhere. The definition is wrong everywhere, because there is no definition — there are five of them, each living in a different tool, each edited by whoever was closest to the ticket.
The semantic layer is dbt’s answer to that gap: define metrics once, close to the modeled data, and let tools query those definitions instead of reinventing them. Define once, query many. The metric lives in version control next to the models it depends on, it goes through code review, and every consumer that asks for revenue gets the same SQL underneath.
This chapter is an orientation. You do not need the semantic layer to build a solid dbt project. You need it when metric definitions start wandering.
The layer above marts
A normal dbt mart answers: what rows and columns should exist?
A semantic model answers: how should this data be interpreted for metrics?
The underlying mart is orders, one row per order. The semantic model declares entities, dimensions, and measures on top of it:
semantic_models:
  - name: orders
    model: ref('orders')
    defaults:
      agg_time_dimension: order_date
    entities:
      - name: order
        type: primary
        expr: order_id
      - name: customer
        type: foreign
        expr: customer_id
    dimensions:
      - name: order_date
        type: time
        type_params:
          time_granularity: day
      - name: status
        type: categorical
    measures:
      - name: revenue
        agg: sum
        expr: amount
      - name: order_count
        agg: count
        expr: order_id
This YAML does not create a new table. It describes how a metrics engine should aggregate the existing one. Three things are worth reading closely, because each maps to a concept you already know from modeling.
Entities are keys with a role. A primary entity is the grain of the semantic model — one row per order_id, exactly the promise orders already makes. foreign entities are the keys you would join on: customer_id. MetricFlow uses these to figure out how to connect this semantic model to others. If a separate customers semantic model declares customer as its primary entity, MetricFlow now knows it can group order metrics by any dimension that lives on the customer — plan, first_order_date — without you writing the join. The entity name is the contract: two semantic models that both call a key customer are asserting they mean the same customer.
Dimensions are how you slice. A categorical dimension (status) is a group-by column. A time dimension (order_date) is special: it is the axis every time-series question hangs off. The defaults.agg_time_dimension: order_date line tells MetricFlow which time dimension to use when a query asks for a metric “by month” without naming a column. That default is what makes metric_time — the abstract time axis you query against — resolve to order_date for these measures.
Measures are aggregations, not values. A measure is a pair of agg and expr. revenue is sum(amount). order_count is count(order_id) — and because orders is one row per order, that plain count is honest. That honesty is not automatic; it depends entirely on the grain of the model underneath. The moment a measure sits on a table that fans out, count starts lying, and you have to reach for count_distinct. The next section is exactly that case.
When the grain fans out
orders is one row per order, so counting is easy. But payments are not one row per order — an order can be paid in installments or across methods, so stg_payments has several rows per order_id. That fan-out is where the counting rules stop being obvious, and it is the whole reason count_distinct exists. A second semantic model makes it concrete:
  - name: payments
    model: ref('stg_payments')
    entities:
      - name: payment
        type: primary
        expr: payment_id
      - name: order
        type: foreign
        expr: order_id
    dimensions:
      - name: payment_method
        type: categorical
    measures:
      - name: payment_count
        agg: count
        expr: payment_id
      - name: orders_paid
        agg: count_distinct
        expr: order_id
      - name: payment_amount
        agg: sum
        expr: amount
Read the two count measures side by side. payment_count is count(payment_id) — one per payment row, so it counts payments. orders_paid is count_distinct(order_id) — collapsing the fan-out, so it counts orders. On stg_payments those two numbers genuinely differ: an order paid in three installments contributes three to payment_count but one to orders_paid. Getting that count_distinct right once, here, is the entire point: no dashboard author ever has to remember that stg_payments fans out below the order grain. (payment_amount is safe to sum either way — the installments partition the order’s total rather than duplicate it — but the row counts are where the fan-out bites.)
This is the lesson the semantic layer encodes so you only learn it once: the correct aggregation depends on the grain of the model underneath, and the YAML is where you pin it down.
Metrics name the business question
A measure is an aggregation attached to a semantic model. A metric is the business-facing object:
metrics:
  - name: revenue
    type: simple
    label: Revenue
    description: Sum of order amounts across all statuses.
    type_params:
      measure: revenue
  - name: order_count
    type: simple
    label: Order count
    type_params:
      measure: order_count
Now “revenue” is not a formula pasted into five dashboards. It is a named metric in the dbt project, with a description that says in English what it means — including the decision that it counts every status, so the next person who disagrees argues with the definition instead of quietly forking it. A simple metric is the common case: take a single measure and expose it as something the business can ask for by name.
The other metric types build on top of that. There are five in MetricFlow — simple, ratio, derived, cumulative, and conversion — and the bookshop has a natural use for the first four.
Ratio metrics divide one metric by another. Average order value is revenue over the number of orders:
  - name: average_order_value
    type: ratio
    label: Average order value
    type_params:
      numerator: revenue
      denominator: order_count
The reason to make this a metric rather than a measure is grain independence. If you ask for average_order_value by month, MetricFlow computes the monthly numerator and the monthly denominator separately and then divides — it does not average a pre-divided per-row number, which would give you the wrong answer. The ratio type encodes “divide the aggregates, in this order, at whatever grain you asked for.”
Derived metrics are an expression over other metrics, and this is where offsetting in time earns its keep. Month-over-month revenue change is “this month’s revenue minus last month’s” — the same metric, aliased and offset:
  - name: revenue_mom_change
    type: derived
    label: Revenue change vs. prior month
    type_params:
      expr: revenue - revenue_prev_month
      metrics:
        - name: revenue
        - name: revenue
          alias: revenue_prev_month
          offset_window: 1 month
The metrics list names the inputs — here the same revenue metric twice, once offset a month back — and the expr combines them. Because both inputs are the revenue metric, they inherit its definition: if you ever change how revenue treats a status, this comparison updates for free on both sides. That shared lineage is the point of building it out of metrics rather than hand-writing a windowed query.
Cumulative metrics accumulate a measure over time. A running total of revenue:
  - name: cumulative_revenue
    type: cumulative
    label: Running revenue (all-time)
    type_params:
      measure:
        name: revenue
With no window, a cumulative metric is an all-time running total: each period includes everything up to and including it. Add a window and it becomes a trailing sum, which is how you get a rolling 7-day or 30-day revenue number:
  - name: trailing_7d_revenue
    type: cumulative
    label: Rolling 7-day revenue
    type_params:
      measure:
        name: revenue
      cumulative_type_params:
        window: 7 days
Cumulative metrics are the one type that leans hardest on infrastructure you have to set up: MetricFlow needs a time spine — a model that lists one row per day — so it has a complete calendar to accumulate against, including days with no orders. Without it, a running total silently skips empty days and your chart lies by omission. On DuckDB the spine is a few lines:
-- models/metricflow_time_spine.sql
with days as (
    select unnest(
        range(
            date '2020-01-01',
            date '2030-01-01',
            interval '1 day'
        )
    )::date as date_day
)
select date_day from days
You then register it in YAML so MetricFlow knows this is the calendar and which column carries the day grain:
models:
  - name: metricflow_time_spine
    time_spine:
      standard_granularity_column: date_day
    columns:
      - name: date_day
        granularity: day
Note where time_spine: sits: it is a property of the model, nested inside its entry in the models: list — not a top-level key. Putting it at the top level is the most common way this configuration fails to take effect.
Without it, a running total silently skips empty days and your chart lies by omission. This is the most common “why is my cumulative metric wrong” answer, and it is worth wiring the spine in before you reach for this type.
Conversion metrics measure how often a base event is followed by a conversion event for the same entity, within a window — “of the customers who added a book to their cart, what fraction ordered within 7 days?” This is the one type the bookshop cannot express, and it is worth being honest about why: conversion needs two timestamped events per entity — an add_to_cart and an order — and the bookshop’s data is only customers, orders, and payments. There is no event stream. If you did model one, the metric would look like this:
  # Illustrative only — the bookshop has no cart-events model.
  - name: cart_to_purchase_rate
    type: conversion
    label: Cart-to-purchase rate (7-day)
    type_params:
      conversion_type_params:
        entity: customer
        window: 7 days
        base_measure:
          name: add_to_cart_events
        conversion_measure:
          name: order_count
The entity: customer line is what ties the two events to the same person; the window bounds how long the conversion has to happen. I am showing it against a hypothetical cart-events model on purpose — conversion is the metric type that most reveals whether your event data is modeled with stable entities, not just your facts. If the two sides do not agree on what a customer is, the metric is meaningless no matter how clean the YAML looks. The bookshop simply does not have the event data to make it real, and pretending otherwise would be exactly the kind of invented number this chapter is trying to kill.
The metric definition carries the logic. Query tools ask for average_order_value by day, status, or customer plan; they do not recalculate it from scratch.
Entities are the join contract
Entities tell the semantic layer how things relate: order, customer, payment. They are the semantic equivalent of a model’s grain and keys.
This is where dimensional modeling comes back. If your marts have sloppy grains and weak keys, the semantic layer cannot save you. It will only encode the confusion. A good semantic layer rests on boring facts and dimensions: one row per thing, stable keys, clear relationships.
Concretely: MetricFlow resolves “revenue by customer plan” by starting at the orders semantic model, following the customer foreign entity to whatever semantic model declares customer as primary, and picking up plan from there as a dimension. That traversal only works if the keys line up and the grains are honest. Declare customer as primary on a model that actually has two rows per customer and every metric grouped through it quietly double-counts — and it will look completely reasonable in the YAML. The semantic layer does not validate your grain; it trusts the word primary.
That is why this chapter comes late. You should understand sources, models, tests, snapshots, contracts, and deployment before metrics. The semantic layer is not a shortcut around modeling discipline. It is a consumer of it.
A note on verification. Unlike most of this book, the commands in this chapter were not run against the companion project. The semantic models and metrics below are written to MetricFlow’s documented spec, and the
mfinstall line above is verified — but the bookshop repo ships nosemantic_models:, somf querywas never exercised end to end here. Treat the YAML as correct-per-docs and the output as illustrative. If you build it,mf validate-configsis the first command to run, precisely because it catches the mistakes this chapter cannot.
Querying metrics
With the semantic layer configured, you can query metrics from the command line — but which command depends on which dbt you are running, and this trips people up constantly:
- dbt Core (what this series uses): install MetricFlow alongside your adapter —
uv pip install "dbt-metricflow[dbt-duckdb]"— and the CLI ismf. Mind the extra’s name: it is the adapter package (dbt-duckdb), not the database (duckdb). Get it wrong anduvshrugs —warning: The package dbt-metricflow does not have an extra named duckdb— installs MetricFlow without the adapter, and leaves you debugging a connection error that has nothing to do with your metrics. Swap indbt-snowflake,dbt-bigquery,dbt-postgresas appropriate. - dbt Cloud: the same commands are spelled
dbt sl …through the Cloud CLI, which proxies them to the hosted Semantic Layer API.
The grammar is identical; only the entrypoint differs. Everything below shows the Core form. Start by listing what exists:
mf list metrics
mf list dimensions --metrics revenue
Then ask a real question — revenue by month and status:
mf query \
  --metrics revenue \
  --group-by metric_time__month,orders__status
The grammar is worth decoding. metric_time__month is the abstract time axis (metric_time) at a month grain — MetricFlow resolves metric_time to each metric’s agg_time_dimension, which for our measures is order_date. The double underscore is MetricFlow’s path separator: orders__status means “the status dimension reached through the orders semantic model.” You can filter and order the same way:
mf query \
  --metrics revenue,average_order_value \
  --group-by metric_time__month \
  --where "{{ Dimension('orders__status') }} = 'completed'" \
  --order-by metric_time__month
Two metrics, one query, guaranteed to use the same time grain and the same filter — which is exactly the consistency a pile of hand-written dashboard SQL cannot promise. To see what MetricFlow actually generated, ask it to explain rather than run:
mf query --metrics revenue --group-by metric_time__month --explainThat prints the compiled SQL. Reading it once is instructive. Stripped to its essence, revenue by month compiles to roughly:
select
    date_trunc('month', order_date) as metric_time__month,
    sum(amount) as revenue
from analytics.orders
group by 1
order by 1
That is exactly the SQL you hope every analyst would write, and precisely the SQL they keep getting slightly wrong — one groups by date_trunc('week', …), one filters out cancelled orders and one does not, one counts payment rows instead of orders. MetricFlow generates it the same way every time, and for the multi-model queries it also joins the semantic models on their entity keys, joins the time spine for metric_time, and applies your --where filters — the same joins and the same count_distinct every consumer would otherwise have to remember to write by hand. This has two advantages:
- The same definition powers multiple tools.
- The generated SQL follows the modeled relationships instead of every dashboard author hand-joining tables.
It also introduces a new dependency. If the semantic model is wrong, every tool using it is wrong consistently. Consistency is only good when the definition is correct.
Two habits keep it correct. First, validate the configuration before you trust a query — mf validate-configs (dbt sl validate in Cloud) checks that every entity resolves, every measure’s expr references real columns, and every metric’s inputs exist, catching a mistyped statu or a dangling denominator before a dashboard does. Run it in CI next to your model builds. Second, promote the queries you run often into saved queries so they live in version control instead of someone’s shell history:
saved_queries:
  - name: monthly_revenue_by_status
    query_params:
      metrics:
        - revenue
        - average_order_value
      group_by:
        - TimeDimension('metric_time', 'month')
        - Dimension('orders__status')
    exports:
      - name: monthly_revenue_by_status
        config:
          export_as: table
A saved query names a metric-plus-grouping combination once; the exports block lets mf export (dbt sl export in Cloud) materialize it back into the warehouse as a table or view for tools that cannot speak the Semantic Layer API. It is the bridge between “governed metric” and “plain table a legacy dashboard can read.”
Core, Cloud, and where serving lives
Be clear-eyed about the boundary here, because it is easy to oversell. MetricFlow itself is open-source and works with dbt Core. You can install dbt-metricflow, define semantic models and metrics, and run mf query locally against DuckDB, Postgres, Snowflake, or any supported adapter, entirely for free. Everything in this chapter up to now runs on Core. What Core does not give you is the hosted Semantic Layer API — the JDBC/GraphQL endpoint that Tableau, Hex, and friends connect to so they all read the same metric definition. That endpoint, and the dbt sl CLI that talks to it, are dbt Cloud features. On Core you get one consistent generator of SQL; on Cloud you get one consistent service every BI tool can query.
What Core does not give you is a hosted serving layer. The piece that lets Tableau, Hex, Mode, Google Sheets, or a custom app fetch metrics over a stable API — the dbt Semantic Layer API, exposed as JDBC, GraphQL, and a Python interface — is a dbt Cloud feature. Cloud runs MetricFlow behind that API, handles auth and caching, and presents your metrics to BI tools as if they were a queryable database of governed measures. So the honest split is:
- Defining and testing metrics, and querying them locally or in CI: dbt Core, via MetricFlow and the
mfCLI. - Serving those metrics to BI tools and applications through a governed API: dbt Cloud.
If someone tells you “the semantic layer” as a product, they usually mean the Cloud serving API. If someone tells you “MetricFlow,” they mean the engine that both Core and Cloud use to compile metric requests into SQL. Knowing which one a claim depends on will save you from promising a Tableau integration that your Core-only setup cannot deliver.
When you need it
You probably do not need the semantic layer for a personal project, a two-person analytics team, or the first week of a new warehouse. Plain marts, tests, and careful documentation are enough.
You should consider it when:
- the same metric appears in multiple BI tools;
- teams disagree about definitions;
- a metric needs governed dimensions and filters;
- dashboards duplicate complex aggregation logic;
- downstream tools need a stable API for metrics;
- the cost of inconsistent numbers is higher than the cost of semantic maintenance.
And you can safely skip it when a single BI tool already owns your metric definitions and everyone queries through it. A well-governed layer in Looker’s LookML, or one carefully maintained set of measures in a single Tableau workbook, solves the same “define once” problem for a single-tool shop. The semantic layer earns its keep specifically when metrics have to be consistent across tools, or when you want the definitions to live in version control and dbt’s DAG rather than inside a BI vendor’s format. If you have exactly one consumer, the marts-plus-BI-layer approach is often the lighter answer.
The semantic layer is a coordination tool. It pays for itself when coordination is the problem.
What still belongs in marts
Do not move everything into metrics. Marts should still do the durable modeling work:
- clean source data;
- define grain;
- join facts to dimensions where appropriate;
- calculate row-level business fields;
- handle slowly changing dimensions;
- expose tested keys and measures.
The semantic layer should define how those measures aggregate and combine. If a formula is needed row by row, put it in a model. If it is an aggregation definition, consider a metric.
The line is the grain. A calculation that makes sense for one row belongs in the model; a calculation that only exists once you group and aggregate belongs in a metric. Rolling each order’s payments up to a single amount per order lives in int_order_payments — it is true of a single order. “Revenue by month” is a metric — it does not exist until you sum. Average order value is the clearest case: there is no such thing as the average order value of one row, so it cannot be a column; it only means anything as a ratio of two aggregates, which is exactly what the ratio metric expresses. When you are unsure which side a calculation belongs on, ask whether it is true of a row or only of a group.
Governance does not disappear
Metrics need owners, descriptions, and review. A bad metric definition is harder to notice than a bad SQL model because it may live one layer away from the generated query.
Use the same discipline:
- document the metric in plain English;
- name the owner;
- test the underlying measures;
- compare metric output against known examples;
- version breaking changes where consumers depend on them.
That last point has teeth here. Because the semantic layer decouples the definition from the consumer, a change to revenue — say, deciding it should exclude returned orders — propagates to every dashboard silently — nobody gets a merge conflict, nobody sees a broken build, the number just changes. So the review bar for a metric edit should be higher than for a model edit, not lower: the blast radius is every tool that ever queried it. The upside of “define once” is that one fix reaches everywhere; the risk is that one mistake does too. A semantic layer without governance is just another place for definitions to drift.
Final thoughts
The semantic layer is not where a dbt project starts. It is where a successful project often ends up, once the marts are stable and the organization wants metrics to mean one thing everywhere. Define entities so joins are safe. Define measures so aggregations are explicit. Define metrics so business language has a single home. Then let tools ask for the metric instead of re-learning the formula. The payoff is not fancier SQL; it is fewer meetings about why two dashboards disagree.
That’s the expanded dbt series. You can build the project, organize it, test it, scale it, govern it, deploy it, and decide when metrics deserve their own layer. The rest is practice on data that matters.
Comments