Rows Into Columns: Pivoting Without Leaving SQL
Turning a category column into one column per value using conditional aggregation — sum/count with FILTER, the portable CASE form, the tablefunc crosstab alternative, and unpivoting back to rows with LATERAL and a VALUES list. Run against PostgreSQL 18.
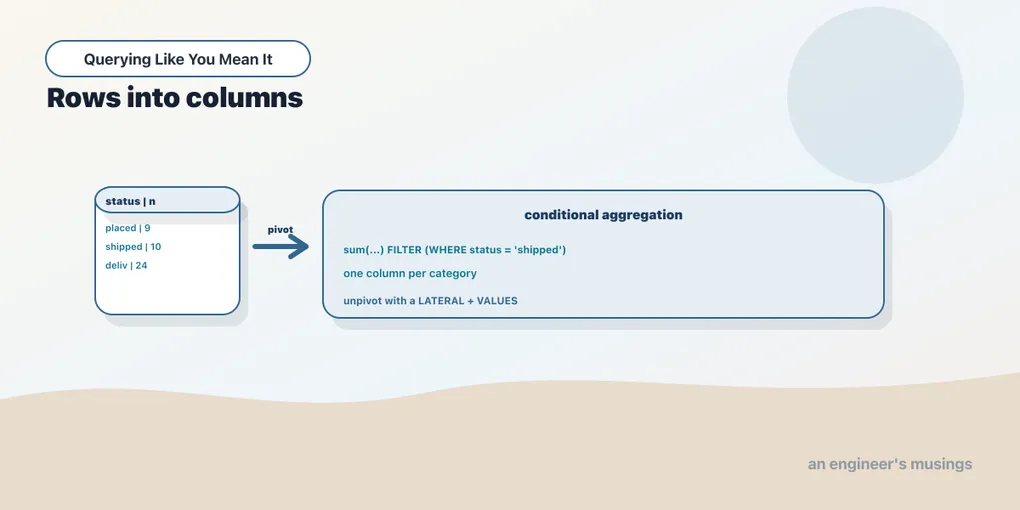
A pivot is the move where a category stops being a value living in one column and becomes a set of columns of its own. Instead of five rows — one per order status — you want one row with five status columns side by side, the shape a dashboard or a spreadsheet wants. Some databases ship a dedicated PIVOT keyword. Postgres does not, and it turns out you don’t need one: pivoting is just aggregation where each output column carries its own row filter. You already met the key ingredient in Series 1, the FILTER clause. This chapter puts it to work.
Pivoting is conditional aggregation
The idea: GROUP BY the thing you want on the rows — here, the month. Then, for each thing you want across the columns — here, each status — write an aggregate that only counts the rows matching that value. The FILTER (WHERE ...) clause attaches a per-aggregate row filter, so one count(*) FILTER (WHERE status = 'shipped') counts only shipped orders. You write one of those per status:
SELECT to_char(date_trunc('month', order_date), 'YYYY-MM') AS month,
       count(*) FILTER (WHERE status = 'placed')    AS placed,
       count(*) FILTER (WHERE status = 'shipped')   AS shipped,
       count(*) FILTER (WHERE status = 'delivered') AS delivered,
       count(*) FILTER (WHERE status = 'returned')  AS returned,
       count(*) FILTER (WHERE status = 'cancelled') AS cancelled,
       count(*)                                     AS total
FROM orders
WHERE order_date >= '2025-01-01' AND order_date < '2025-07-01'
GROUP BY date_trunc('month', order_date)
ORDER BY month;
month | placed | shipped | delivered | returned | cancelled | total
---------+--------+---------+-----------+----------+-----------+-------
2025-01 | 318 | 310 | 768 | 331 | 155 | 1882
2025-02 | 273 | 280 | 684 | 308 | 125 | 1670
2025-03 | 291 | 308 | 776 | 343 | 137 | 1855
2025-04 | 308 | 290 | 790 | 315 | 162 | 1865
2025-05 | 308 | 341 | 768 | 273 | 172 | 1862
2025-06 | 287 | 280 | 785 | 295 | 137 | 1784
(6 rows)That is a pivot, built out of parts you already know. The GROUP BY date_trunc('month', ...) makes one row per month. Each FILTERed count fills one status column. And a plain count(*) with no filter gives the row total — a free sanity check, since the five status columns sum to it. The columns are fixed at write time, one per status you list. That’s the one real constraint of SQL pivoting: the column list is static. You have to know the categories when you write the query. If a sixth status appears in the data, this query silently ignores it until you add a column for it.
The portable form: sum(CASE …)
FILTER is standard SQL and clean, but it isn’t universal — MySQL doesn’t have it. The older, fully portable idiom does the same job with CASE inside the aggregate: emit a 1 (or the value to sum) when the row matches, else 0 or NULL, then aggregate. These two produce identical numbers:
SELECT to_char(date_trunc('month', order_date), 'YYYY-MM') AS month,
       sum(CASE WHEN status = 'placed'  THEN 1 ELSE 0 END) AS placed,
       sum(CASE WHEN status = 'shipped' THEN 1 ELSE 0 END) AS shipped
FROM orders
WHERE order_date >= '2025-01-01' AND order_date < '2025-04-01'
GROUP BY date_trunc('month', order_date)
ORDER BY month;
month | placed | shipped
---------+--------+---------
2025-01 | 318 | 310
2025-02 | 273 | 280
2025-03 | 291 | 308
(3 rows)Same 318 and 310 as the FILTER version. Use FILTER on Postgres for readability, and know the CASE form for anywhere else. The CASE trick generalizes past counting: sum(...) pivots revenue per status, not just a row count. Any aggregate works — avg, max, sum — because a pivot is nothing more than an aggregate that only sees the rows for its column. Here’s revenue rather than a count, pivoted by status with genre on the rows:
SELECT b.genre,
       round(sum(oi.quantity * oi.unit_price) FILTER (WHERE o.status = 'delivered'), 2) AS delivered_rev,
       round(sum(oi.quantity * oi.unit_price) FILTER (WHERE o.status = 'returned'),  2) AS returned_rev,
       round(sum(oi.quantity * oi.unit_price) FILTER (WHERE o.status = 'cancelled'), 2) AS cancelled_rev
FROM order_items oi
JOIN books b  ON b.book_id = oi.book_id
JOIN orders o ON o.order_id = oi.order_id
WHERE b.genre IN ('Sci-Fi','History','Poetry')
GROUP BY b.genre
ORDER BY b.genre;
genre | delivered_rev | returned_rev | cancelled_rev
---------+---------------+--------------+---------------
History | 655045.34 | 260220.15 | 127934.07
Poetry | 616212.80 | 251257.39 | 125878.61
Sci-Fi | 645844.66 | 268564.85 | 131286.41
(3 rows)Same skeleton, different aggregate — the columns now hold money instead of order counts. One subtlety worth internalizing: a count(*) FILTER (...) returns 0 for a cell with no matching rows, but a sum(...) FILTER (...) returns NULL, since summing zero rows is NULL, not zero. Wrap the sum in COALESCE(..., 0) if you need the empty cells to read as zero rather than blank.
The crosstab alternative
Postgres does ship a dedicated pivot, but it lives in an extension: the tablefunc module’s crosstab() function. After CREATE EXTENSION tablefunc;, crosstab() takes a query producing (row-key, category, value) triples and turns it into a pivoted result. It has one genuine advantage: it can build columns without you naming each one. But that comes at a cost. You must declare the output column types in a trailing AS (...) clause, the syntax is finicky, and it needs an extension installed — which you may not control on a managed database. For a fixed, known set of categories like our five statuses, conditional aggregation is simpler, needs no extension, and reads as ordinary SQL. Reach for crosstab() only when the categories are many and dynamic; otherwise FILTER wins on clarity.
Unpivoting: columns back into rows
The reverse operation shows up just as often. You have a wide row — several metric columns side by side — and you want it tall, one row per metric, so you can filter or aggregate over it. Postgres has no UNPIVOT keyword either, but LATERAL joined to an inline VALUES list does it cleanly. LATERAL lets the subquery on the right refer to columns from the row on the left. So for each source row, you emit one output row per (label, value) pair you write out:
WITH wide AS (
  SELECT
    count(*) FILTER (WHERE status = 'placed')    AS placed,
    count(*) FILTER (WHERE status = 'shipped')   AS shipped,
    count(*) FILTER (WHERE status = 'delivered') AS delivered
  FROM orders
  WHERE order_date >= '2025-06-01' AND order_date < '2025-07-01'
)
SELECT u.status, u.n
FROM wide
CROSS JOIN LATERAL (VALUES
  ('placed',    wide.placed),
  ('shipped',   wide.shipped),
  ('delivered', wide.delivered)
) AS u(status, n)
ORDER BY u.n DESC;
status | n
-----------+-----
delivered | 785
placed | 287
shipped | 280
(3 rows)The single wide row from the CTE became three tall rows. Each VALUES tuple pairs a literal label with the matching column from wide, and the AS u(status, n) names the two output columns. This is the standard Postgres unpivot: a VALUES list of (name, column) pairs, cross-joined LATERAL so each pair can read the current row. For unpivoting many identically-typed columns, unnest() over two parallel arrays (unnest(ARRAY['placed','shipped'], ARRAY[wide.placed, wide.shipped])) does the same job more compactly.
Final thoughts
Pivoting in SQL isn’t a special keyword, it’s conditional aggregation with intent: GROUP BY what you want on rows, and write one filtered aggregate per column you want across the top — FILTER on Postgres, sum(CASE ...) everywhere. The catch: the columns are fixed when you write the query, so a new category is invisible until you add it. The trailing count(*) total is your check that nothing fell through. crosstab() exists for dynamic columns at the price of an extension and fussier syntax. And to go the other way, LATERAL (VALUES ...) folds a wide row back into tall rows. Both directions lean on the same building block — CASE — which is exactly what the next chapter is about.
Not run.
crosstabwas not run: installing the extension modifies the database, and this bookshop is read-only.
Comments