Ready, Running, and Serving Nothing but 500s
Timeouts, retries and outlier detection in ambient — including the Gateway API field that does not exist, and the one thing a mesh does that Kubernetes structurally cannot.
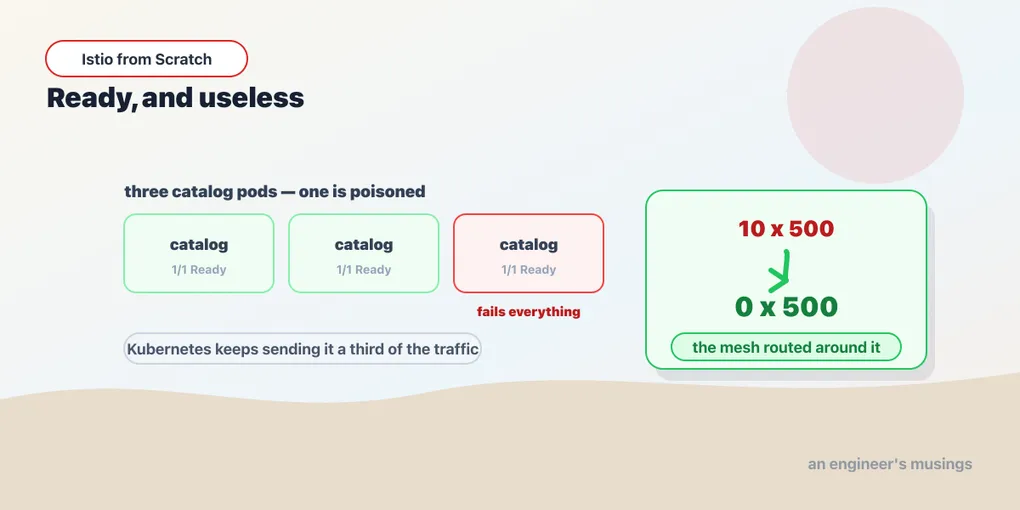
Three catalog pods. All three 1/1 Running. All three passing their readiness probes every three seconds without a stumble, all three listed in the EndpointSlice with ready: true. And one request in three to the catalog comes back a 500.
Kubernetes is not lying to you — it is answering a question you did not ask. It asked each pod whether it considered itself fit to receive traffic, each pod said yes, and Kubernetes wrote that down. Nobody in the entire control plane has any opinion about whether the pod’s answers are any good, and one of those three pods has been returning an error to every single caller for the last four minutes while cheerfully reporting itself healthy.
That pod is the last third of this chapter, and it is the strongest argument for a service mesh in this whole book. But we get there by way of two smaller things — both of which the mesh will also do to your traffic without your application ever finding out. It will give up on a slow request, and it will quietly re-send a failed one.
All three are the same trick from a different angle. Your application does not change. The thing in the path between the caller and the callee changes its mind about what to do with a request that is going badly — that is the entire idea, and it is why none of this requires you to open a source file. In ambient, that thing is the waypoint, so everything in this chapter needs one and everything in this chapter is Envoy underneath.
Timeouts, and the route that attaches to a Service
Start with the smallest intervention there is: a caller decides it is not prepared to wait more than a second.
The bookshop’s catalog has a /debug/slow?ms=N endpoint that does nothing but sleep, so we can make a request take exactly as long as we want it to. Ask it for three seconds and it will take three seconds, and orders will sit there holding a goroutine and a connection the entire time — which, multiplied across a busy service, is how a slow dependency becomes an exhausted caller, and how an exhausted caller becomes an outage two hops away from the thing that actually broke.
A timeout is the fix, and the interesting part is whose fix it is. A timeout is a statement about how long the caller is willing to wait. It has nothing to do with the callee, which is often perfectly happy to take three seconds and has no idea anyone minds. Without a mesh, that statement lives in a client library, in whatever language the caller happens to be written in, configured however that language’s HTTP client configures things — which means it lives in n places, in m languages, and half of them are the framework default, which is usually “forever”.
Here is the same statement, once, as a Kubernetes object:
apiVersion: gateway.networking.k8s.io/v1
kind: HTTPRoute
metadata:
  name: catalog-timeout
  namespace: bookshop
spec:
  parentRefs:
    - group: ""
      kind: Service
      name: catalog
      port: 80
  rules:
    - timeouts:
        request: 1s
      backendRefs:
        - name: catalog
          port: 80
Look hard at parentRefs. In the last chapter, and in the Kubernetes series’ Gateway API chapter, every HTTPRoute you wrote had a Gateway as its parent — that is north-south routing, traffic arriving from outside the cluster and being handed to a service. This route’s parent is a Service.
That is the ambient idiom, and it is worth slowing down for, because it is the mechanism by which L7 policy attaches to east-west traffic at all. There is no gateway in the path when orders calls catalog — it is a pod calling a ClusterIP, and there is nothing there to hang a route on. So Gateway API’s mesh binding says: attach the route to the Service, and whatever L7 proxy is bound to that Service will enforce it. In ambient, the L7 proxy bound to that Service is the waypoint — and no waypoint means no enforcer, a theme that is about to become the entire subject of the next chapter.
Applied, the route reports:
route status:
parent=Service/catalog Accepted=TrueAccepted=True, and the parent it names is Service/catalog, not a Gateway. Now make a request that cannot possibly finish in a second, and one that easily can:
/debug/slow?ms=3000 -> http=504
/debug/slow?ms=200  -> http=200
The 504 is the waypoint giving up at one second and telling the caller so. The 200 is a fast request sailing through untouched. The application was never changed, was never rebuilt, and never knew. Nobody edited a Go file, nobody set an environment variable, nobody restarted a pod — a YAML object appeared in the cluster, and the shape of failure changed.
Two things about that 504 that people get wrong.
It is a fast error, not an absence of an error. The point of a timeout is never that the request succeeds — it is that the request fails quickly and predictably, so the caller can release its resources, return an honest error to its own caller, and get on with life. You have converted an unbounded wait into a bounded one, and that is the whole product. If your service cannot tolerate a 504 any better than it tolerates a hang, the timeout has not helped you — it has just moved the failure earlier, and you have work to do in the caller.
The waypoint stops waiting. Whether catalog stops working is a separate question, and it is a question about catalog. When the waypoint gives up it resets the upstream stream, and a well-behaved server notices the cancelled request and abandons the work. Whether the bookshop’s handler actually does that — whether the three-second sleep is genuinely torn down, or whether a goroutine sits there sleeping out its remaining two seconds to no purpose — is something I did not measure, and you should not assume. A timeout at the proxy protects the caller. It is not a load-shedding mechanism for the callee, and treating it as one is how you end up with a service whose CPU is entirely occupied with work that nobody is waiting for any more.
Gateway API’s timeouts block also carries a backendRequest field alongside request — the per-attempt bound as opposed to the overall bound. I did not run it, and it only becomes meaningful once there are multiple attempts, which brings us to the next section, which does not work.
The retry field that is not there
The obvious next move is retries, in the obvious next place. Add a retry stanza to the same HTTPRoute, next to the timeouts you just proved:
$ kubectl apply -f catalog-retry.yaml
Error: HTTPRoute in version "v1" cannot be handled as a HTTPRoute: strict decoding error:
unknown field "spec.rules[0].retry"
There is no retry field in an HTTPRoute. Not “you spelled it wrong”, not “the version is off” — the field does not exist in the API you have installed. Gateway API ships features in channels: standard is the stable, GA surface, and experimental is where fields live while they are still moving. We installed Gateway API 1.4.0 standard — which is what a sane person installs in a cluster they care about — and in the standard channel of v1.4, retries have not landed.
So write the sentence down, because it will save you an afternoon and it is the kind of thing a book assembled from conference talks will not tell you: in ambient today, retries mean a classic Istio VirtualService. HTTPRoute has not replaced VirtualService. It is replacing it — the direction of travel is real, timeouts and weighted splits and header matching are all HTTPRoute now — but the replacement is partial, and you will be running both APIs side by side in the same mesh for years. Anyone who tells you Gateway API is the whole story has not tried to configure a retry.
Here is the one that works:
apiVersion: networking.istio.io/v1
kind: VirtualService
metadata:
  name: catalog-retries
  namespace: bookshop
spec:
  hosts:
    - catalog
  http:
    - route:
        - destination:
            host: catalog
      retries:
        attempts: 3
        retryOn: 5xx
To prove it does something, we need an upstream that fails. /debug/fail?pct=50 makes the catalog fail half its requests, interleaved, so there is no pattern to get lucky against. Forty requests, no retries:
40 requests: 21 x 200, 19 x 500Nineteen failures out of forty — exactly what you would expect from a coin flip, and exactly what a customer would see. Now apply the VirtualService above, change nothing else — the catalog is still failing half its requests, the switch is still on — and run the same forty:
40 requests: 40 x 200, 0 x 500Zero failures. The catalog is still broken. It is failing half of everything it is asked to do, right now, as those forty 200s are being counted. The waypoint is simply asking it again, and again if it has to, until it gets an answer it can hand back to the caller. The application still fails half its requests. The caller stopped noticing.
That number — forty out of forty — is the most seductive result in this chapter, and it is the one I want you to be most suspicious of.
Retries are a loaded gun
Read that experiment back with a mean eye.
Retries multiply load on a service that is already failing. With three attempts, a service failing 50% of requests sees roughly 1.75 times the traffic it would otherwise get. That sounds survivable. Now make the service fail because it is overloaded — the failure mode you will actually meet — and watch what happens: it is drowning, so it starts returning 500s, so every caller sends each request up to three times, so it is now drowning in three times the water. The failures rise, so the retries rise. This is a positive feedback loop with no natural damping, and it is called a retry storm, and it is the mechanism by which a partial outage becomes a total one in under a minute. The chapter on readiness and liveness had a version of this — the fleet that restarts itself into a database outage — and it is the same shape: a well-intentioned automatic response that adds load to a system whose problem is load.
Retries are only safe on idempotent operations. retryOn: 5xx will happily retry a POST /orders. Consider what a 500 actually tells you — it tells you the server said “something went wrong”, and it tells you nothing whatsoever about when. The order may not have been written. The order may have been written and the response lost on the way back. From the waypoint’s point of view those are the same event, and it will retry both. Retry a GET all day. Retry a DELETE, which is idempotent by definition. Think very hard before you retry anything that creates something — and if you must, make the operation idempotent first with a request-scoped key, which is a change in your application, and there is no proxy configuration on earth that substitutes for it.
Budget them. Three attempts is not a large number, but “three attempts, on every route, from every caller” is a multiplier applied to your entire fleet at exactly the moment it is least able to absorb one. Envoy has the machinery for this — a perTryTimeout so an attempt cannot eat the whole budget, and retry budgets that cap retries as a fraction of active requests rather than as a fixed count per request. I did not run either of them, and I am telling you they exist rather than showing them to you. What I will say from the shape of the thing is that attempts: 3 with no per-try timeout, sitting underneath an overall request timeout, is three attempts if there is time — and the interaction between an outer timeout and an inner retry count is the sort of thing you should reason about on paper before you find out in production.
And the big one: you have hidden a real failure from the caller, and it is still there. Those forty 200s are a lie of omission. Half of the work the catalog did in that window failed. If the only place you look is the caller’s error rate, you have just made a broken service invisible to yourself — the graph you watch went green while the service it describes went on failing. This is not an argument against retries. It is an argument that a retry policy is only safe in a system where somebody can still see the underlying failure rate, and that means the metrics from the proxy, not from the caller. Which is chapter twelve, and it is the reason it is a chapter and not a footnote.
The pod that is Ready and useless
Now the one that a mesh does and Kubernetes cannot.
Go back to readiness and liveness, because the whole beat depends on remembering exactly what a readiness probe is. Readiness answers one question — should this pod receive traffic? — and it is answered by the pod, about itself, to the kubelet on its own node. The answer flips the ready condition on the pod’s address in the EndpointSlice, kube-proxy excludes addresses whose ready condition is false, and that is the entire mechanism by which Kubernetes routes around a sick pod. There is nothing else. Kubernetes knows exactly as much about a pod’s health as that pod is willing to tell it.
So poison one.
The bookshop exposes /debug/poison, which makes this pod fail every single request it receives — while continuing to pass its readiness probe. That is not a contrived trick. It is the most common shape of a real production failure there is — a pod whose /readyz returns ok because the HTTP server is answering, while everything the pod is actually for is broken. A poisoned connection pool. A wedged client to a downstream service. A cache that came up empty. A config reload that went wrong in a way that only affects the real path. In every one of those cases the pod is sincerely, confidently wrong about itself — and there is no readiness probe you can write to catch it, because the pod is the one writing the report.
One of the three catalog pods, poisoned:
### Poison ONE catalog pod out of three: catalog-6c4f598bdb-48wb4
  poisoned
And now Kubernetes’ view of the world:
catalog-6c4f598bdb-48wb4  READY=1/1  Running
catalog-6c4f598bdb-ftbgd  READY=1/1  Running
catalog-6c4f598bdb-jxpmc  READY=1/1  Running
Three for three. 1/1. Running. Nothing is wrong, says the cluster, about a pod that is at this moment returning an error to every request it is given. The readiness probe still passes, so the address still carries ready: true, so kube-proxy still forwards to it, so the Service still sends it its share. Kubernetes has no idea one of them is useless, and it will go on sending it a third of your traffic until somebody notices.
Thirty requests through the Service, no mesh policy of any kind in force:
30 requests: 20 x 200, 10 x 500 (~1 in 3 hits the poisoned pod)One in three. That is not a mystery — it is arithmetic. Three endpoints, one of them broken, a Service that load-balances at random, and a third of everything lands on the pod that cannot do anything with it.
Here is the object that fixes it:
apiVersion: networking.istio.io/v1
kind: DestinationRule
metadata:
  name: catalog-outlier
  namespace: bookshop
spec:
  host: catalog
  trafficPolicy:
    outlierDetection:
      consecutive5xxErrors: 3
      interval: 5s
      baseEjectionTime: 60s
      maxEjectionPercent: 50
Read it as English. Every five seconds, look at each host behind this Service. If a host has returned three 5xx in a row, take it out of the load-balancing pool for sixty seconds. Never take out more than half the pool at once.
Give the waypoint a warm-up — a handful of requests, because before it can eject a host it has to watch that host fail three times, and those three failures are real requests belonging to real callers. Then thirty more:
30 requests: 30 x 200, 0 x 500And now the punchline, which is the sentence this chapter exists for:
The poisoned pod is still Running. Still Ready. Still in the EndpointSlice, still carrying ready: true, still being forwarded to by kube-proxy. Kubernetes never removed it, was never asked to remove it, and to this day does not believe there is anything wrong with it. The mesh routed around it anyway.
That is a capability Kubernetes does not have and cannot have, and the reason is not an oversight — it is definitional. A readiness probe is a pod’s opinion of itself. Outlier detection is the callers’ opinion of it. One is a self-report; the other is a peer review conducted continuously by everyone who actually depends on the thing. A pod that is broken and knows it is handled perfectly well by readiness, and you do not need a mesh for that. A pod that is broken and does not know it is invisible to every mechanism Kubernetes has, forever, and it is precisely the pod that will ruin your evening.
Every time somebody asks me whether their platform team should be running a service mesh, this is the experiment I describe. Not mTLS, not the policy language, not the graph. Three pods, one liar, and a load balancer that noticed.
The knobs, and the one that stops the mesh eating your fleet
Four fields, and they are not decoration.
consecutive5xxErrors: 3 — how much rope a host gets. Set it to 1 and a single unlucky 500, from a host that is fine, ejects it for a minute; on a service with a genuine 0.1% error rate you will be ejecting healthy pods at random forever. Set it to 20 and your poisoned pod serves twenty errors per detection window before anyone notices. It is the same detection-latency budget as periodSeconds × failureThreshold on a probe, and it has the same shape of answer: no setting is both instant and safe.
interval: 5s — how often the detector sweeps. Ejection is not instantaneous; it happens on the sweep, and the sweep is the smallest unit of time in which anything can change.
baseEjectionTime: 60s — the minimum time an ejected host stays out. Envoy scales this by the number of times a host has been ejected, so a host that keeps coming back and keeps failing stays out for longer and longer — an exponential backoff on trust, which is exactly the right instinct. I read that in Envoy’s documentation; I did not sit and watch a host get ejected twice to confirm the multiplier.
maxEjectionPercent: 50 — and this is the safety valve, and it is the one that stops outlier detection from being the most dangerous thing in your cluster.
Think about what happens during a real outage. Not one bad pod — the database is down, or a bad config reached every replica, and every host behind catalog is now returning 500s. Outlier detection, doing exactly what you told it, observes three consecutive failures on host one and ejects it. Then host two. Then host three. And now the load-balancing pool is empty, and the mesh has converted a service that was failing some requests into a service that cannot receive any, and the pool cannot recover because no traffic reaches it to prove it is better. You have automated a partial failure into a total one.
maxEjectionPercent is the circuit breaker on the circuit breaker. At 50, no matter how bad things get, half the hosts stay in the pool and keep taking traffic — degraded, error-serving, and reachable. That is the correct behaviour, because at that point the mesh is no longer the right tool. Something is systemically broken, ejecting hosts is not going to fix it, and the least harmful thing a load balancer can do is keep delivering the traffic and let the errors be visible.
The default, if you write outlierDetection and leave the field out, is 10% — deliberately timid. Raise it when you know what you are doing, and never to 100.
One more honest note. Outlier detection is passive. It is not a health check, it does not probe anything, and it has no independent opinion. It learns exclusively from the requests your users are making — which means your users pay for the education, and in our run that bill came to ten 500s before the policy existed and a warm-up’s worth after it did. It is a scoreboard kept by the callers, and a scoreboard cannot tell you about a game nobody played. A host that is idle is a host that is never ejected.
Final thoughts
Look at what the three tools in this chapter actually did, in a row, and the pattern is uncomfortable.
The timeout took a request that was going to hang and made it fail faster. The retry took a service that was failing half its requests and made it appear to fail none. The outlier detection took a pod that was returning errors to everybody and made it stop returning errors to anybody, by ensuring nobody ever spoke to it again.
Every single one of them made the failure quieter. Not smaller — quieter. The slow endpoint is still slow. The catalog is still failing half of everything it does. The poisoned pod is still poisoned, still Running, still 1/1, and now it is not even generating errors, because it is not getting any traffic to fail. Your dashboards are green. The bug is exactly where it was.
That is the honest bargain of a resilience layer, and it is a bargain worth taking — a service that survives its dependencies’ bad days is worth a great deal, and the alternative is a pager at 3am for a blip that would have cleared itself. But it is a loan, not a gift. The mesh is buying you availability now against a promise that somebody will go and look at what it papered over, and if nobody ever goes and looks, you are running a system whose failures you have systematically taught yourself not to see. The retry made your error rate a fiction. The ejection made your capacity a fiction. Nothing told you.
So the only responsible way to turn any of this on is to turn on the thing that makes the failures visible again first — the metrics the proxies were emitting all along, which show you the 500s the retry hid, the 504 the timeout produced, and the host the mesh quietly stopped talking to.
Before that, though, there is the chapter this book was written to write. The mesh has spent nine chapters deciding how to move your traffic. Now it decides whether to move it at all — and it turns out that the way a mesh says no is not the way you have been told.
Comments