Twenty Traces, One Span Each
The mesh injects the trace headers, and your app throws them away — so I fixed the app, and the trace still did not connect. The one thing in these three books that did not come for free, reported honestly.
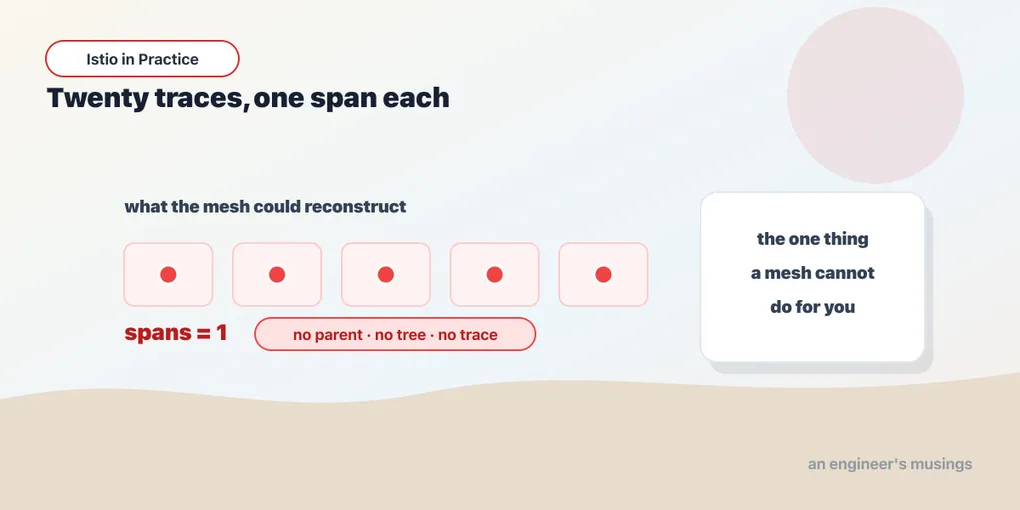
Everything in these three books has come for free.
The mTLS came for free — one label, zero restarts, every connection between every service encrypted and mutually authenticated. The metrics came for free: request counts, response codes, a complete identity-attributed call graph, out of an application that has never contained a line of monitoring code. The access logs came for free, eight lines of YAML and no rebuild. The fault injection came for free. The authorization, the retries, the timeouts, the canary — all of it, delivered to an eight-hundred-line Go application by a platform the application does not know exists.
This chapter is where that ends. And it does not end tidily, which is why it is the chapter I most want you to read.
The mesh does its half, and it does it perfectly
Start with the good news, because it is real and it is easily demonstrated. Put an echo server behind the waypoint, send it a request from a curl loop, and ask it to print the headers it received. It gets these, and nobody asked for them:
x-b3-traceid:  52eb620db02638f69bc8ef3d2c6ce6f7
x-b3-spanid:   9bc8ef3d2c6ce6f7
x-b3-sampled:  1
x-request-id:  61678c75-1043-981d-a009-06614d42a09c
Read those four lines carefully, because they are the mesh keeping its promise.
x-b3-traceid is a trace identifier — a 128-bit number naming a single logical operation as it moves across your system. x-b3-spanid identifies this particular hop within it. x-b3-sampled: 1 is the sampling decision, taken once, at the edge, and carried forward — the value you configured with randomSamplingPercentage in the last chapter, made concrete as a bit in a header that says “record this one”. And x-request-id is the same UUID you met in the access log, the join key across every proxy log line the request produces.
The application did not generate any of that. The application does not know what B3 is. The waypoint Envoy generated the trace ID, decided it was sampled, wrote all four headers into the request, and handed the request to the app — and then reported a span about that hop to the collector, on its own, in the background, with no cooperation from anybody.
So the mesh has done its half. Nobody instrumented anything, and there is a trace ID sitting in your inbound request right now.
Which makes it entirely reasonable to expect that distributed tracing now works.
Twenty requests, twenty traces, one span each
The lab is Istio 1.30.2 in ambient mode, Jaeger collecting, meshConfig.extensionProviders pointing at Jaeger’s Zipkin-compatible endpoint on zipkin.istio-system:9411, and a Telemetry object with randomSamplingPercentage: 100.0 — so every request is sampled, and nothing can hide behind “you missed it”.
Twenty requests through the front door. Each one enters at the ingress gateway, hits web, and web fans out to catalog and orders. Three hops, two services deep, the most ordinary microservice call graph in the world.
Here is what Jaeger knows about the whole thing:
services known to Jaeger: ["jaeger", "waypoint.bookshop"]Two. One of them is Jaeger reporting on itself. So the entirety of the bookshop — web, catalog, orders, the gateway — appears in the trace store as exactly one service. And it is not a service. It is a proxy.
And here are the traces:
trace 2b661c46e397  spans=1  ops=['orders.bookshop.svc.cluster.local:80/*']
trace babb3334f292  spans=1  ops=['catalog.bookshop.svc.cluster.local:80/*']
trace b0acdcfddb38  spans=1  ops=['orders.bookshop.svc.cluster.local:80/*']
trace 3ac0b383ccef spans=1 ops=['catalog.bookshop.svc.cluster.local:80/*']spans=1. Every single one.
Not a shallow tree. Not a tree with a hop missing. A trace containing exactly one span is not a distributed trace at all — it is a single event with a UUID on it — and calling a pile of them a tracing system is like calling a drawer of unmatched socks a wardrobe.
Look at what that output is actually telling you. Each hop began a brand-new trace. The request to catalog got a trace ID; the request to orders got a different trace ID; and the request to web that caused both of them is not in there at all. There is no parent anywhere — nothing linking the four hops of one user’s request into one user’s request. There never was, and no amount of Jaeger configuration was ever going to conjure it.
Twenty requests went in. Jaeger has a scattering of disconnected stubs and no idea that any of them are related.
The lie, stated plainly
Here is the claim, and you have seen it on every service mesh slide ever produced:
Distributed tracing, with no code changes.
It is not true. It has never been true. It is not true of Istio, it is not true of Linkerd, and it is not true of any mesh that has ever been built or that ever can be — and the reason is not a missing feature. It is the shape of the problem.
Follow the request. A proxy sees an HTTP request arrive at web. It generates a trace ID, stamps it into the headers, reports a span for the hop it just witnessed, and passes the request into the process. Excellent. Now web does its work — and calls catalog.
That outbound call is a brand-new HTTP request. It was constructed by your application code, on a socket your application opened, in a function your application wrote — and it has fresh headers, because http.NewRequest gives you fresh headers. The proxy in the path sees a request go by and it looks, in every observable respect, like a request somebody just decided to make. It is on a different connection. It may be on a different goroutine, a different thread, a different worker pool. There is nothing in the packets — nothing on the wire, nothing at any layer of the network — that says this request exists because that other request came in.
Only one component in the entire system knows that those two requests are related. Not the proxy. Not the collector. Not Kubernetes, and not the control plane.
It is your application. It is the four lines of code between the inbound request and the outbound one — and no amount of infrastructure can reach inside a process and establish causality that only the process knows about.
A mesh can generate a trace ID and attach it to a request arriving at your pod. What it cannot do is carry that ID from the request you received onto the request you send.
That is the whole thing. It is a small sentence and it kills a very large marketing claim. And it is the same limit — wearing a different hat — as the one the previous book’s telemetry chapter found in saturation: the mesh knows the wire and nothing but the wire. A thread pool is inside the process, so the mesh cannot see it. Causality between two requests is inside the process, so the mesh cannot see that either. Two gaps, one cause, and both of them permanent.
The fix, which is real code, and which you must write
So the app has to do it. Here is exactly what that means, from the bookshop’s actual source — committed to the companion repo, and the thing you actually need:
// TRACE PROPAGATION — the one thing a service mesh cannot do for you.
//
// The mesh will happily generate a trace ID and attach it to the request arriving
// at your pod. What it cannot do is reach inside this process and carry that ID
// from the request you RECEIVED onto the request you SEND. Only your code knows
// those two things are related.
var traceHeaders = []string{
	"x-request-id",
	"traceparent", "tracestate", // W3C
	"x-b3-traceid", "x-b3-spanid", "x-b3-parentspanid", "x-b3-sampled", "x-b3-flags", // B3
	"x-ot-span-context",
}

// Propagate copies the tracing headers from an inbound request onto an outbound one.
func Propagate(in *http.Request, out *http.Request) {
	for _, h := range traceHeaders {
		if v := in.Header.Get(h); v != "" {
			out.Header.Set(h, v)
		}
	}
}

// GetWithTrace performs an outbound GET that continues the inbound request's trace.
func GetWithTrace(client *http.Client, in *http.Request, url string) (*http.Response, error) {
	out, err := http.NewRequestWithContext(in.Context(), http.MethodGet, url, nil)
	if err != nil {
		return nil, err
	}
	Propagate(in, out)
	return client.Do(out)
}
That is it — that is context propagation, in Go, complete. Twenty-odd lines including the comment, and every one of them is doing something worth understanding.
The header list is three families, and you copy all of them. traceparent/tracestate are W3C Trace Context, the modern standard. The x-b3-* set is B3, Zipkin’s format, and it is what Istio’s Envoys emit by default — which is why the echo server saw x-b3-traceid and not traceparent. x-ot-span-context is OpenTracing’s, and it is legacy. And x-request-id is not a trace header at all — it is the correlation ID from the access log.
You copy every one of them because you do not control what is upstream of you. Today it is a waypoint emitting B3. Tomorrow a team fronts you with something that emits W3C, or a partner calls you with an OpenTelemetry SDK in the path, and the header your code is carefully forwarding is not the header the request arrived with. Copying nine headers costs you nine map lookups on a request that is about to cross a network — the cost is not measurable, and the failure mode of getting it wrong is a broken trace you will not notice for six months. Copy them all.
Note what Propagate takes: two *http.Requests. Not a context, not a global, not a thread-local, not a package-level variable. The inbound request and the outbound one, in the same function, at the same time. That is not a stylistic choice — it is the only shape this can have. The trace context is a property of a request in flight, and it has to be threaded through your handler from the request that came in to the request that goes out. In Go that means passing the *http.Request (or its context.Context) down every call path that might make an outbound call, and if you have ever wondered why Go people are so insistent about passing ctx as the first argument to everything, this is one of the reasons. A codebase that stashes request state in globals cannot be traced. Not “is hard to trace” — cannot, because two concurrent requests would overwrite each other’s trace IDs, and the traces you produced would be worse than no traces at all, because they would be confidently wrong.
And it has to exist in every service in the chain. Every one. The bookshop’s web calls catalog and orders, so web needs it; orders calls catalog, so orders needs it. A single service in the middle that drops the headers does not degrade the trace gracefully — it breaks it, at that hop, and everything downstream of it becomes an orphan with a fresh trace ID and no parent. That is the property that makes context propagation an organisational problem rather than a coding one: it is only as good as the least diligent service in the call path, and in a company of any size that service is owned by somebody you have never met.
Which is the real argument for doing this in shared library code, once, and not in each handler. The bookshop’s version is a package function that every service imports. In your organisation it should be in the HTTP client wrapper that every service already uses, so that propagation is what happens when someone makes a call by default, and forgetting it requires effort. If you make it opt-in, you will get partial traces forever.
And it still did not work
I added that code to the bookshop. web uses GetWithTrace on its outbound calls to catalog and orders. orders uses it on its call to catalog. I rebuilt the image, loaded it into the cluster, restarted the pods, waited for them to come up, and ran twenty fresh requests through the front door with sampling still at 100%.
span-count distribution: {1: 20}Twenty traces. One span each. Again.
I want to be extremely clear about what I am reporting, because this is the point in a technical article where the author usually stops running things and starts describing them, and where — if you go back and read carefully — the screenshots quietly begin coming from somebody else’s cluster.
The propagation code is correct — I have read it, you have read it, and it does exactly what the previous section says it must do. The mesh is injecting the headers, because I watched an echo server receive them. The sampling is at 100%, so nothing is being dropped. Jaeger is up and receiving spans, because it has spans — twenty of them, one at a time, from waypoint.bookshop. And the trace still does not connect.
I did not get to the bottom of it. That is the honest sentence, and I am going to leave it standing rather than dress it up.
My leading hypothesis, which I did not verify: the only service emitting spans in that lab is waypoint.bookshop — the waypoints in front of catalog and orders. The inbound hop into web does not appear to be producing a parent span. The ingress gateway routes to web, and if no root span exists for that hop, then the catalog and orders waypoint spans have nothing to be children of — so each one does the only thing it can do with an orphan, and starts a fresh trace.
That is a plausible story. It fits the evidence — it explains the single-span traces, it explains why Jaeger knows only one non-Jaeger service, and it explains why fixing the application did not fix the symptom. It is also just a story. I did not confirm it. I did not dump the Envoy config on the gateway, I did not compare the trace IDs arriving at web with the ones arriving at catalog, and I did not run the same topology in sidecar mode to see it work. Any one of those would have turned the hypothesis into a fact, and I ran out of lab before I ran out of ideas.
So there is no trace tree in this chapter. I have not drawn you one, I have not borrowed one, and I have not pasted a screenshot from the Istio documentation with our service names on it — because the whole premise of these three books is that you can tell the difference between what I ran and what I read, and the moment I show you a beautiful waterfall diagram I did not produce, every other number in this project becomes worth less.
What is not run, and what I would do next
Explicitly, so you can plan around it:
- Sidecar-mode tracing is not run. This is the well-trodden path — it is what every Istio tracing tutorial on the internet is actually demonstrating, whether it says so or not, and it would very likely produce the connected tree, because in sidecar mode there is an Envoy in every pod, including
web, and the inbound hop towebtherefore has a proxy that can produce a root span. If you look at my hypothesis and at that sentence together, they are suspiciously compatible. I did not run it, so I am not claiming it. - The OpenTelemetry provider is not run. I used the
zipkinextension provider pointed at Jaeger. Istio also supports anopentelemetryprovider, which is where the ecosystem is going and which is what I would reach for next. - Tail-based sampling is not run. The
randomSamplingPercentagein the last chapter is head-based: the decision is made at the edge, before anybody knows whether the request is interesting. Tail-based sampling keeps the trace after seeing how it went — every error, every slow request, 1% of the boring ones — which is obviously what you want and requires a collector that can do it. It is a property of your tracing backend, not of Istio. - An instrumented HTTP client is not run.
Propagatecopies headers by hand, which is correct, explicit, and exactly what I wanted for a chapter about what the mesh does not do. In production you would more likely use an instrumented client —otelhttpin Go, or your language’s equivalent — which does the propagation for you and produces application-level spans, which is a strictly better place to be. The manual version is the version that teaches; the library version is the version that ships.
Write the code anyway
Here is the thing I want you to take from a chapter that failed to produce a trace tree: write the propagation code regardless. It is the correct code, it is mandatory, and it pays even in the state I am reporting.
Three reasons.
It is a precondition, not an optimisation. Nothing you do to your infrastructure will ever make tracing work without it — not a different mesh, not a different backend, not sidecars, not OpenTelemetry. Every one of those options is downstream of an application that carries the context, and if your app drops the headers then every tracing project your company undertakes for the next five years will fail for the same reason and nobody will know why. It is twenty lines. Write them now, while the mesh’s tracing story matures around you.
The sampling decision only works if it is carried. Look back at x-b3-sampled: 1. That bit is the edge saying “record this one” — and if a service in the middle drops it, the next hop has no decision to honour and makes its own. With head-based sampling at 1%, a chain of five services that do not propagate gives you a 1% chance of recording each hop independently, which means your chance of a complete five-hop trace is roughly one in ten billion. Propagation is not just what links the spans; it is what makes the sampling coherent.
And x-request-id pays off immediately, with no tracing backend at all. This one is worth spelling out, because it is the reason to merge the change today rather than when the tracing project gets funded. That UUID is in the access log line from the last chapter. If every service forwards it, then one grep for that UUID across your log store gives you every proxy log line the request produced, at every hop, with a duration on each — the request’s path through your system, in your existing logging stack, with no Jaeger, no collector and no sampling. That is most of the value of a trace, for none of the infrastructure. I did not run that combination — I am reasoning from two things I did run, the log line and the header injection, and joining them in my head rather than at a terminal. Verify it in your own cluster; it will take you ten minutes and it is the highest-leverage ten minutes in this chapter.
The ceiling, even when it works
One more thing to understand about mesh-generated traces, and it applies just as much on the day this all works perfectly.
The spans a mesh produces are hop spans. web called catalog, and it took 40 milliseconds. That is what a proxy can see, because a proxy stands on the wire and watches a request cross it. What the proxy cannot see, and will never see, is what happened inside those 40 milliseconds — the database query that took 38 of them, the lock that half your handlers are blocked on, the JSON deserialisation of a 4 MB response, the cache lookup that missed.
So even the beautiful connected trace tree — the one I could not produce, the one on the front page of every observability vendor’s website — is a tree of network hops with your business logic as opaque boxes. It will tell you, with total precision, which service is slow. It will not tell you why, and the “why” is the reason you opened the trace.
To get inside the box you have to instrument the box, which means spans emitted by your own code, around your own database calls, in your own handlers — an OpenTelemetry SDK, or the instrumented client above, or otelhttp and its friends. And at that point the mesh is doing the plumbing and your application is doing the interesting part, which is the correct division of labour and exactly the one the previous book’s telemetry chapter argued for: let the mesh have the boring 80% you would otherwise rebuild badly, and spend your entire instrumentation budget on the part only your code can see.
Final thoughts
I could have written this chapter differently. I had all the material for the version that works: the header injection is real and demonstrable, the propagation code is correct and committed, and the trace tree is right there in Istio’s documentation and in a thousand blog posts, rendered beautifully, ready to be pasted in with a caption implying I produced it. Nobody would have checked. Nobody ever checks.
I am not doing that, and the reason is not principle — it is utility, and it is worth being precise about which.
If I show you a trace tree I did not produce, I have given you a false confidence with a real cost. You adopt ambient partly because tracing came free in a chapter you read. You spend a quarter on it. And you discover, on your own topology, with your own deadline, the thing I already knew and did not tell you: that this is the least mature corner of the ambient data plane, and that it may take you longer than you budgeted. My screenshot cost you a quarter. The sentence I am writing instead — “test it on your own topology before you commit” — costs you an afternoon, and it is the single most valuable thing in this chapter.
So here is the honest state of the world as I measured it, in July 2026, on Istio 1.30.2 in ambient mode. The mesh injects the trace headers — verified. An application that drops them produces single-span garbage — verified, twenty times out of twenty. The application-side fix is small, mandatory, and I have shown you the exact code. And with the fix in place, on my topology, I still could not produce a connected trace, and I do not know why.
Ambient’s tracing story is less mature than the sidecar’s. That is not a slur on ambient — I would still take ambient, and the cost chapter will show you numbers that make the choice look obvious. It is a statement about where the sharp edges currently are, and this is one of them.
Which produces a decision rule that is genuinely useful, and that I would not have been able to give you if I had written the tidy version of this chapter:
If tracing is your reason for adopting a service mesh, do not adopt one on my word, or anybody else’s. Stand up your own topology, run twenty requests through it, and count the spans. If you get a tree, wonderful — you have learned something I did not. If you get {1: 20}, you have learned it in an afternoon in a lab instead of in a quarter in production, and you have learned it from your own cluster, which is the only cluster whose behaviour was ever going to matter to you.
Everything else in these three books came for free. Tracing does not, and I would rather you heard that from me than from a retrospective.
Next: The Setting Said REGISTRY_ONLY. The Internet Said 200.
Comments