The Bill Is a Table Too
The cost model of the bookshop's lakehouse, populated from the lab's own request and byte counts: what a commit costs, what a streaming writer costs a day, what compaction buys back, what the metadata file costs the catalog per load, and what the unreferenced files cost until they are cleaned. Then the operating model that owns each line, and the production review that puts the whole book on one page.
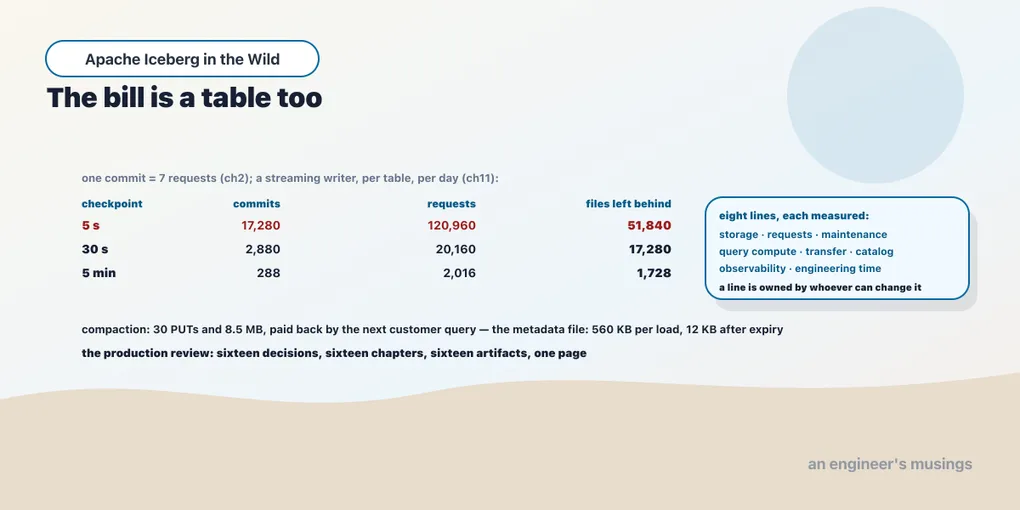
Chapter 2 counted the requests behind every operation on a one-table bookshop. Chapter 11 measured a streaming writer committing every five seconds. Put the two together.
  one commit (ch2):       7 requests   (1 PUT data, 2 PUT metadata, 2 GET metadata, 2 HEAD)
  one day at 5 s (ch11):  17,280 commits  x  7  =  120,960 requests, before a single query runs
  of which PUTs:          51,840   (priced at roughly ten times a GET)
  files left behind:      51,840 data files, 17,280 manifests, 17,280 manifest lists, 17,280 metadata files
That is the writer’s bill, per table, per day, on an idle platform — and none of it is a query. The same calculation connects the other measurements to a budget: multiply an operation’s footprint by how often the platform runs it, then apply the store’s price. The prices in this chapter are the published list prices of one large object store at the time of writing, and they are labelled as such. The book did not run against it. The counts are the lab’s, and they are the part that transfers.
Those costs need owners as well as estimates. The eight-line model below connects each expense to a measurement and a decision; the production review then checks who owns that decision and what evidence supports it.
The eight lines
| Line | What it counts | Where the number comes from |
|---|---|---|
| storage | bytes on the store, referenced and not | ch9’s 171 MB of metadata copies; ch15’s twice-the-rows prefix |
| requests | PUT, GET, LIST, DELETE per operation | ch2’s table; ch8’s compaction; ch11’s commit rate |
| maintenance compute | engine time for rewrites, expiry, cleanup | ch8’s seconds per rewrite; ch13’s pack at a second per table |
| query compute | engine time per query | ch6’s medians; ch9’s planning share |
| transfer | bytes leaving the store’s region | the load-table payload, times engines; replication, ch16 |
| catalog service | requests to the catalog and its payload | ch9’s 560 KB per load; ch15’s forty-seven log lines per session |
| observability | the pack, the health table, the logs | ch13’s hourly pass |
| engineering time | the runbooks, the drills, the reviews | ch14’s eight runbooks; ch16’s game day |
The measurements below fill the model where the lab supplies a count or duration. Engineering time remains an explicit, unmeasured line.
Requests: the commit is the unit
Chapter 2’s table gave a one-row insert a fixed footprint of seven requests and a fifty-thousand-row insert thirteen. The cost of writing is the number of commits — not the number of rows. Chapter 11’s streaming writer is therefore the most expensive thing on the platform per byte, and the checkpoint interval is its price control.
| Checkpoint interval | Commits per day | Requests per day | PUTs per day | Files created per day |
|---|---|---|---|---|
| 5 s | 17,280 | 120,960 | 51,840 | 51,840 data + 51,840 metadata |
| 30 s | 2,880 | 20,160 | 8,640 | 17,280 |
| 5 min | 288 | 2,016 | 864 | 1,728 |
At the published prices, PUTs at five thousandths of a cent per thousand and GETs at four ten-thousandths, the five-second row is about thirty cents a day in requests. The number that matters is not the thirty cents. It is the fifty-one thousand files, each of which every query has to open until chapter 8’s compaction folds them, and each of which chapter 9’s manifests reference until expiry. A writer at five seconds has to be paired with maintenance at chapter 11’s schedule — or the request bill moves from the writer to every reader.
Requests: what compaction buys back
Chapter 8’s numbers, on the streaming-shaped table.
  before compaction:  customer query 450 GETs, 2.4 MB;   day query 15 GETs
  compaction:         150 -> 30 files, 8.5 MB written, 30 PUTs, 1.0 s
  after:              customer query 100 GETs, 7.6 MB;   day query 3 GETs
The rewrite cost thirty PUTs and 8.5 MB of transfer within the region. Every customer query after it saves 350 GETs, every day query saves twelve. At the published prices the rewrite’s thirty PUTs cost about what one customer query’s 350 GETs cost, so in requests alone it pays for itself after the first query that follows it. The first draft of this sentence said two hundred queries; the cost model in the companion, run with the same numbers, said one — and the model was right. The byte column went the other way, tripling per customer query, and on a store that prices egress the calculation has a second term. Chapter 8’s return-on-cost rule is this arithmetic with the platform’s own query rate in it. A compaction that does not pay back inside its own schedule interval is scheduled too often.
Storage: the bytes nobody references
The storage bill includes objects a query never counts: old metadata copies, replaced data files and files retained by holds. These measurements put a size on each source.
  ch9:   601 metadata files, 171 MB, for a table whose data is under 1 MB;  500 of them orphans after retention was set
  ch15:  the curated orders prefix holds 120,150 rows of files for a 60,075-row table
  ch10:  a tag doubles a table's data storage through one compaction
Storage on a lakehouse is data, plus history, plus orphans, plus holds — and only the first is what a SELECT count(*) describes. The published storage price is a little over two cents per gigabyte-month. That makes none of this expensive at the bookshop’s size, and all of it expensive at a thousand times the bookshop, where the metadata-copy line alone is the size of a small table per table. The lines are bounded by chapter 10’s retention, chapter 9’s delete-after-commit, and chapter 14’s orphan cleanup. The health pack’s store-minus-metadata check is how the model knows what it is paying for.
Catalog service: the payload per load
Chapter 9 measured the load-table response at 560 KB for a table with six hundred snapshots and 12 KB after expiry. Chapter 15 measured one Spark session’s read as forty-seven catalog requests. Chapter 13’s pack makes nineteen metadata queries per table per pass.
  40 engines and dashboards x 1 load/minute x 560 KB  =  32 GB/day of catalog egress for one unexpired table
  the same table after expiry:                            0.7 GB/day
  the health pack, hourly, 1,000 tables:                  19,000 catalog requests/hour
A managed catalog prices requests and, sometimes, egress; a self-hosted one prices the machine and, chapter 3 found, the database behind it. Either way the payload is the lever, and the payload is the snapshot count — which is chapter 10’s retention policy expressed in bytes.
Compute: maintenance and queries
The maintenance compute line is the sum of the schedules. Chapter 8’s rewrites at a second per streaming-shaped table. Chapter 9’s manifest rewrites, chapter 10’s expiry, chapter 14’s cleanup. Chapter 13’s pack at a second per table per hour. On the bookshop’s few hundred tables it is minutes of one engine per hour. The query compute line is chapter 6’s and chapter 7’s medians times the query rate. The only thing this book can say about it in general is chapter 9’s finding: a query’s planning share is fixed by the manifest count and its execution share by the file count, so both maintenance lines reduce it.
Transfer: replication is a read of everything
Chapter 16 replicated 570 objects and 5.6 MB in 2.8 seconds. A replica region reads every byte the primary writes, once, plus every byte replication re-copies. For a copy that runs metadata-first that is nothing; for one that runs data-first it is the validation’s re-copy. At the published inter-region transfer price, two cents a gigabyte, the bookshop’s replica is cents a day. A platform’s is the same fraction of its write volume, and the write volume is the streaming writers’ fifty thousand files a day times their size.
The operating model: who owns each line
| Line | Owner | Decides | Reviews with |
|---|---|---|---|
| requests | the writer’s team | checkpoint interval (ch11), commit batching | the platform team, from ch13’s commit cadence |
| maintenance | the platform team | ch8–10 schedules, ch11’s per-class schedule | the fleet score (ch8) |
| storage | the platform team | retention classes (ch10), cleanup (ch14) | the store-minus-metadata check (ch13) |
| catalog | the platform team | retention, delete-after-commit (ch9), vending (ch15) | load-table size per table |
| query compute | the consumers | layout requests to the platform (ch6, ch7) | interleaved medians |
| transfer | the platform team | replication order and interval (ch16) | the game-day drill |
| observability | the platform team | the pack, the rules, the classes (ch13) | rule accuracy over the health table |
| engineering time | everyone | the runbooks (ch14), the drills (ch16), this review | the post-incident list |
The ownership rule is the one chapter 13 found for alerts: a line is owned by whoever can change the number. The writer’s team owns requests because they own the checkpoint interval. The platform owns storage because it owns retention. A line with two owners is a line nobody reduces.
The production review
The production review fits on one page per platform. Each row links a decision to its evidence and the artifact that implements it, so the review can distinguish an operating policy from an intention.
| Decision | Chapter | Artifact | Status for the bookshop |
|---|---|---|---|
| object store: conditional writes, request pricing understood | 2 | the request table | SeaweedFS; ch2’s table |
| catalog: which, and what it refuses | 3 | the catalog decision record | Polaris, Postgres-backed; the fixture retired (ch8, ch11) |
| conflict classes and isolation levels per table | 4 | the conflict matrix | serializable on orders; snapshot on events |
| engine certification | 5 | the generated matrix | 90 cells; PyIceberg on v3 views flagged |
| table design per workload | 6, 7 | the worksheet; the skew SQL | orders bucketed by customer (ch7) |
| compaction policy | 8 | the decision tree; the fleet score | binpack, scoped, partial progress; by checkpoint count for upserts |
| metadata and statistics | 9 | the planning-latency probe | manifest cache on; stats for Trino |
| retention classes | 10 | the policy template | hot / audit / dev |
| streaming tables | 11 | the schedule; the runbook | 5 s checkpoints on events; savepoints single-use |
| change data | 12 | the convergence test | landing + curated per source |
| table health | 13 | the SQL pack; the health table | hourly; classes declared |
| incidents | 14 | eight runbooks | rehearsed on the lab |
| authorisation | 15 | the policy test suite | vending everywhere; Trino behind access control |
| disaster recovery | 16 | the game-day script | cold replica catalog; metadata-first replication |
| managed or not | 17 | the operating-model matrix | self-hosted, reviewed yearly |
| cost | 18 | this model | the eight lines, populated |
Launch approval is every row having an artifact that exists, a status that was measured rather than asserted, and an owner from the table above. The bookshop’s page has one open row — chapter 5’s Kafka Connect sink — and one row that is judgment rather than measurement, chapter 17’s. A platform is ready when its page reads like that: every number traceable to a run, every gap named.
SLOs, from the numbers
The service levels the review commits to, each one a metric chapter 13’s pack or a writer’s dashboard already produces.
| SLO | Target | Source |
|---|---|---|
| freshness, streaming tables | checkpoint interval + 1 | ch11, ch13 |
| convergence time, change data | one checkpoint | ch12’s test |
| commit success | every checkpoint completes; restores counted | ch11’s REST counts |
| planning latency | metadata requests per query flat | ch9’s probe |
| load-table payload | under 64 KB per table | ch9, ch13 |
| files per partition | under a threshold set from the fleet’s p90 | ch13 |
| recovery time | registration loop under an hour for the fleet | ch16’s 50 ms per table |
| recovery point | the replication interval | ch16 |
What was not run
Every price in this chapter is a published list price for one store, not a measured bill, and the book says so at each use. Engineering time was not measured at all — it is the line the review exists to make visible. And the query-rate multipliers are the bookshop’s assumptions, which is the one input the model cannot take from the lab.
Exercises
1. Price your writers. For each streaming table, take its checkpoint interval from the snapshot cadence in the health table. Compute commits, requests and files per day with the seven-request footprint. Sort by files per day.
Show answer
The top of the list is the table whose compaction schedule matters most, and usually the one whose checkpoint interval was set for latency nobody asked for. Doubling its interval halves every number in the row and costs the consumer the same seconds of freshness, which chapter 13’s freshness SLO will say whether anyone notices.
2. Price your history. For each table, take the metadata-file size from the health table and multiply by the number of engines that load it per day.
Show answer
The largest product is the table whose retention class is wrong, not the table with the most data. Expiry on that one table changes the catalog line more than any other single action, and the health table records the size before and after.
Final thoughts
The bill turned out to be a table like any other. Eight rows, each one a number this book had already measured, multiplied by a rate the platform chooses and a price the store publishes. The writer’s checkpoint interval was the largest lever and the least visible one. The metadata file was the second. The storage that the table does not count was the line that no query ever showed. Each has an owner, because each has exactly one number that changes it.
The appendix is the format’s next version, as it stood when this edition was written, and which of its promises the pinned release already keeps.
Comments