Six Hundred Copies of the Snapshot List
Six hundred commits, counted at the store: the manifests merged themselves, the metadata file grew to 558 KB and left 171 MB of copies behind, rewrite_manifests bought nothing, retention deleted ninety of six hundred, and the statistics Spark wrote were read by Trino and ignored by Spark.
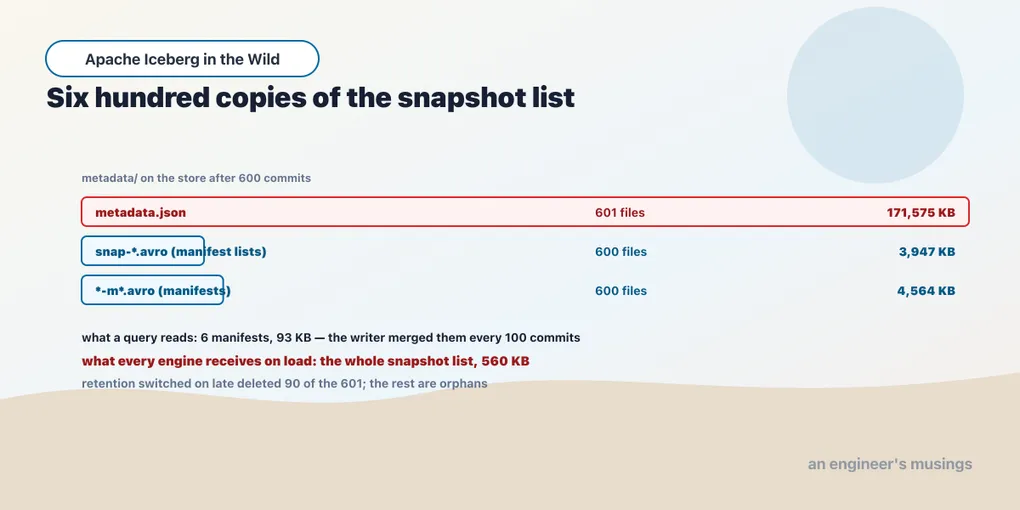
Six hundred small appends to one table, and then a listing of everything under its metadata/ prefix on the store.
  metadata.json                601 files   171,575 KB
  snap-*.avro (manifest lists) 600 files     3,947 KB
  *-m*.avro (manifests)        600 files     4,564 KB
The table’s current metadata — the part a query reads — is six manifests totalling 93 KB and one manifest list of 4.7 KB. Everything else in that listing is history. A manifest list per snapshot, a manifest per commit, and six hundred and one versions of the metadata file. Each version carries the complete list of every snapshot that existed when it was written. The last of them is 558 KB. The sum is 171 MB, for a table whose data is under a megabyte.
Book 1’s chapter 11 isolated planning cost once, and its chapter 13 showed the metadata files nobody deletes. This chapter is what those look like at a platform’s commit rate, measured the way chapter 2 measures everything: requests and bytes at the store, and latency interleaved. The findings run against the folklore in both directions. The thing everyone warns about, manifest accumulation, did not happen, because the writer merges them. The thing nobody warns about, the metadata file, is the one that grows without bound and is served to every engine on every load.
What merges and what accumulates
Spark’s append path can merge manifests as part of a commit. Retaining old metadata files is a separate decision, controlled by separate properties. These defaults were read from the jar.
| Property | Default | What it decides |
|---|---|---|
commit.manifest-merge.enabled | true | whether an append merges small manifests |
commit.manifest.min-count-to-merge | 100 | how many before it does |
commit.manifest.target-size-bytes | 8 MB | how large a merged manifest grows |
write.metadata.previous-versions-max | 100 | how many old metadata files the metadata log tracks |
write.metadata.delete-after-commit.enabled | false | whether the ones that drop off the log are deleted |
io.manifest.cache-enabled | false | whether a FileIO caches manifest content |
cache-enabled | true | whether a catalog caches table metadata, chapter 1’s stale read |
Sampling the metadata tables and fetching the metadata file from storage shows the two processes diverging as commits accumulate.
  after   1 commits:   1 manifests   (7 KB)   metadata.json   2 KB   snapshot-log   1   metadata-log   1
  after  10 commits:  10 manifests  (73 KB)   metadata.json  11 KB   snapshot-log  10   metadata-log  10
  after 100 commits:   1 manifests  (15 KB)   metadata.json 106 KB   snapshot-log 100   metadata-log 100
  after 200 commits:   2 manifests  (31 KB)   metadata.json 196 KB   snapshot-log 200   metadata-log 100
  after 400 commits:   4 manifests  (62 KB)   metadata.json 377 KB   snapshot-log 400   metadata-log 100
  after 600 commits:   6 manifests  (93 KB)   metadata.json 558 KB   snapshot-log 600   metadata-log 100
Read the manifests column first. Ten commits made ten manifests; at the hundredth, Spark’s append merged them into one, and from then on the count is the number of hundreds. The largest manifest holds 594 existing entries and one new one. A Spark batch writer does not accumulate manifests; it pays a merge every hundred commits and keeps the count flat. The merge is not free. The hundredth commit rewrote every entry the previous ninety-nine had written, which is why that manifest is 56 KB where a fresh one is 7 KB, and why the entries in it are marked existing rather than added. One commit in a hundred is a hundred times the size of the others, and a writer on a tight latency budget will notice which one. Whether a Flink checkpoint writer merges at all is chapter 11’s question, because it uses a fast append that skips the merge and leaves one manifest per checkpoint.
Now read the metadata file. It grew by about 0.93 KB per commit, linearly, because it lists every snapshot the table still retains, and none has been expired. Every commit writes a new copy of it. Six hundred commits wrote six hundred copies with an average size of 280 KB, which is the 171 MB. The metadata file is linear in retained snapshots, and the store holds it quadratically. The metadata log inside the file capped itself at a hundred entries, as the property says — and that cap is about to matter.
Who pays for the metadata file
A Spark query through the REST catalog made two requests under metadata/: the manifest list and the one merged manifest. It did not fetch the metadata file. The catalog did, and served it.
  LoadTable response, 600 snapshots:  560 KB
  LoadTable response,  10 snapshots:   12 KB
That is the cost the platform actually carries. Every engine that loads the table receives the whole snapshot list, on every load. Chapter 1 set cache-enabled to false on every engine so that they would see each other’s commits, so there is no cache in front of that payload. Forty engines and dashboards loading a six-hundred-snapshot table is twenty megabytes of catalog egress per round — before any query runs. A catalog that serialises the file on every load is doing that work per request. The number to watch is not manifests. It is the size of the load-table response, which is one curl against the catalog, and the third column of the sample above.
Planning cost, counted
The one-day query against the six-hundred-commit table, and against an identical copy after rewrite_manifests.
  rewrite_manifests on the copy: 6 -> 1 manifests (55 KB)
  one-day query, 600 commits:  metadata GETs 2 (61 KB)   data GETs 60 (30 KB)   median 116 ms
  one-day query, rewritten:    metadata GETs 2 (59 KB)   data GETs 60 (30 KB)   median 119 ms
  count(*), 600 commits:       metadata GETs 7           median 73 ms
  count(*), rewritten:         metadata GETs 2           median 63 ms
The day query showed no improvement; the metadata-only count gained ten milliseconds. Spark’s merge had already reduced the planning work. The rewrite folded six manifests into one, but the day query still read a single manifest: 55 KB instead of 56. And the rewritten manifest’s partition summary spans the whole month, 2026-06-01 to 2026-06-30, because six hundred entries fit in a single manifest under the 8 MB target. A manifest that covers every partition cannot be skipped by any partition predicate. Manifest-level pruning — the thing rewrite_manifests exists to enable — has nothing to work with on a table this size.
rewrite_manifests is for writers that do not merge, and for tables large enough that a manifest can be scoped to a partition range. On a table Spark has been appending to, run the prediction first: count the manifests, and if the count is under a few dozen there is nothing to rewrite. Whether the action clusters output manifests by partition on a table large enough to need several was not measured here and is flagged as such.
Retention, and the files that are already lost
Turning on metadata deletion after six hundred commits tests whether it can clean up the history already on storage. The smaller log limit below asks it to keep ten previous versions.
  600 commits, defaults:  601 metadata.json files on the store, 171,575 KB
  previous-versions-max=10 + delete-after-commit=true, then one commit:
                          511 metadata.json files, metadata-log 10 entries
Ninety files deleted — not five hundred and ninety. The deletion works from the metadata log, and the log was capped at a hundred entries from the hundredth commit on. The five hundred files that fell off the log between commits one hundred and six hundred were untracked the moment they fell off. Nothing in the table knows they exist. They are orphans, 125 MB of them, and only remove_orphan_files will find them.
Set write.metadata.delete-after-commit.enabled at table creation, or accept that every file that has already dropped off the log is an orphan-cleanup job. The default keeps a hundred in the log and deletes none, which on a table committing every minute is a hundred tracked files and an unbounded pile of untracked ones.
Then the operation that actually shrinks the file.
  expire_snapshots retain_last 10: deleted 0 data files, 495 manifests, 591 manifest lists
  metadata.json now 12 KB, 10 snapshots listed; LoadTable response 12 KB
Expiry removed the history that the metadata file was carrying, and the file went from 558 KB to 12 KB. The load-table response followed. Chapter 10 sets the retention policy; this is the number it is setting it for. The order is expire first, so the metadata file is small. Then the retention property keeps the copies of it bounded. Then orphan cleanup, for what was lost before the property was set.
What expiry left is worth reading too: ten manifest lists for ten snapshots, and 106 manifests rather than ten, because each retained snapshot still references the merged manifests of its own generation and the small ones written since. The 495 it deleted were the ones no retained snapshot could reach. Expiry is the only operation in this chapter that deleted anything under metadata/ — and it deleted no data at all.
Statistics: who writes them, who reads them
compute_table_stats writes a Puffin file of theta sketches, one per column, and records it in the metadata file against the snapshot it was computed for.
  compute_table_stats in 1.5s -> 5711940432744176752-….stats, 105,417 bytes
  metadata now lists 1 statistics file: blobs apache-datasketches-theta-v1 for fields 1, 2, 3, 4
  NDV recorded: order_id 59,200   customer_id 20,143   amount 900   ordered_at 59,550
  true values:  order_id 60,000   customer_id 20,000   amount 900   ordered_at 60,000
Within 1.5% on the sketched columns and exact on the small one. The file is 105 KB for four columns of sixty thousand rows. A theta sketch’s size is bounded by its precision rather than by the row count, so it does not grow with the table the way the metadata file does. Then the question a platform has to answer before scheduling that job: which engine reads them.
  Spark 4.1.3, spark.sql.cbo.enabled=true, spark.sql.iceberg.report-column-stats default true:
    EXPLAIN COST self-join on customer_id, before stats: Join ... rowCount=3.61E+9
    EXPLAIN COST self-join on customer_id, after stats:  Join ... rowCount=3.61E+9
  Trino 483:
    SHOW STATS: customer_id distinct 20,000; amount 900; order_id 59,200   (a table without a stats file: blank)
    EXPLAIN self-join on customer_id: Estimates: rows 180,000
Spark wrote the sketches — and its own optimiser did not use them. Its estimate for the join stayed at 3.6 billion rows, which is sixty thousand squared, the estimate you get with no distinct-count at all. Trino read the same file and estimated 180,000, which is sixty thousand squared over twenty thousand, the right answer. A join order chosen from 3.6 billion and one chosen from 180,000 are different plans. Whether some further Spark setting would have made it consume the file was not found, and the chapter says so; what was measured is that the default did not.
Compute statistics for the engines that read them, on the schedule of the snapshots they are computed against. A statistics file is bound to a snapshot. After the next commit it describes the previous one. Trino will use it anyway, which is the right behaviour for a distinct count and the wrong one for a row count. Chapter 13 puts “statistics age” beside “snapshot count” on the dashboard.
Two caches, two kinds of stale
  io.manifest.cache-enabled default:  metadata GETs, three runs of the same query: 2, 2, 2
  io.manifest.cache-enabled=true:     metadata GETs, three runs of the same query: 2, 1, 1
The manifest cache, off by default, keeps manifest content in the engine’s FileIO, up to 100 MB in total and 8 MB per entry. The second run of a query reads the manifest list and nothing else. The manifest list is fetched every time, because it is a different file per snapshot, so the cache cannot make a query blind to a new commit. A manifest is immutable, so a cached one cannot be wrong. The limits are the ones to size: 100 MB per FileIO in total, and no entry over 8 MB. That means a manifest that has grown past the merge target is exactly the one the cache will decline to hold. This cache is safe to turn on everywhere, and on a fleet of engines planning against the same tables it removes one request per manifest per query.
The other cache is the one chapter 1 turned off. cache-enabled caches the table, which is a pointer, and a cached pointer is chapter 1’s incident: Spark reading 50,000 rows while three other engines read 50,002. It has an expiration interval. The policy is to set that interval to the staleness the platform can tolerate, not to leave the default in place because the property’s name sounds harmless. Two caches with similar names — and one of them caches content while the other caches a claim about the present.
Server-side planning
The REST specification defines endpoints for a catalog to plan a scan on the client’s behalf. The catalog returns the file list instead of the metadata the client would need to compute it. That is the mechanism that would take the manifest reads and the load-table payload off the engine entirely.
  fixture 1.10.1     26 endpoints   plan endpoints: none
  Polaris 1.7.0      36 endpoints   plan endpoints: none
  Lakekeeper 0.13.3  25 endpoints   plan endpoints: none
None of the three catalogs on this platform advertises them. What each does offer is in its /v1/config response, which is the first thing to read about any catalog and the one thing this chapter can say with certainty. Book 5 asks the same question of a managed catalog.
The planning-latency probe
Three measurements distinguish work paid by one query from history served to every client: the engine’s metadata requests, the catalog’s load-table response, and the metadata accumulating behind both.
# 1. what the engine reads to plan: requests under metadata/ for one query, at the proxy
grep -c "GET .*/metadata/" s3.log          # before and after the query; the difference is planning

# 2. what the catalog serves on every load
curl -s $CATALOG/v1/namespaces/$NS/tables/$T | wc -c

# 3. what is accumulating
SELECT count(*) FROM t.manifests;            -- flat for a merging writer; climbing for a fast-append one
SELECT count(*) FROM t.snapshots;            -- the metadata file's size, in units of ~1 KB
SELECT count(*) FROM t.metadata_log_entries; -- capped at previous-versions-max; the rest are orphans
Collected per table on chapter 13’s schedule, these measurements can catch catalog traffic growing before a query’s planning time changes. Every engine and dashboard pays for the load-table payload — whereas only the query pays for its own planning requests.
What to decide
Turn on write.metadata.delete-after-commit.enabled at creation, with a previous-versions-max sized for recovery. Chapter 14’s recovery from a bad commit needs the previous metadata file to exist; ten is plenty, a hundred untracked is a leak.
Expire on a schedule that keeps the load-table response small. The snapshot count is the metadata file’s size. Chapter 10 chooses the number; this chapter says what it costs per load.
Do not schedule rewrite_manifests on a Spark-written table without counting manifests first. The writer merges. The rewrite is for fast-append writers, and for tables large enough that manifests can be scoped to partitions.
Compute statistics for the engine that reads them. On this platform that is Trino. Schedule the computation against the snapshot the readers will plan against.
Turn on the manifest cache; set an expiration on the table cache. A cached immutable manifest remains valid. A cached table pointer can miss another writer’s commit, so its lifetime has to match the staleness the platform tolerates.
What was not run
A fast-append writer’s manifest growth, which is chapter 11’s Flink. rewrite_manifests on a table large enough for its output to be split by partition. The Spark setting, if one exists, that would make its optimiser read the Puffin sketches it wrote. And the plan endpoints, which none of the three catalogs here implements, so their cost and their staleness behaviour are Book 5’s to measure against a catalog that does.
Exercises
1. Find the orphaned metadata files. On a table that has been committing for a while with the default retention, count the entries in metadata_log_entries and count the *.metadata.json objects under its metadata/ prefix. The difference is what only remove_orphan_files will remove. Run it with dry_run => true first and check that every file it lists is a metadata file older than the oldest log entry.
Show answer
The log holds at most previous-versions-max entries, a hundred by default, plus the current file. Every metadata file older than the oldest entry is unreferenced. The dry run lists them with their paths; the confirmation is that each one’s version number, in the filename, is lower than the lowest in the log.
2. Measure the load. Take the load-table response size of your largest-history table. Multiply by the number of engines and scheduled jobs that load it per hour, and compare against the catalog’s egress for that hour. Then expire snapshots to the retention policy and measure again.
Show answer
On the lab’s table the response went from 560 KB to 12 KB with the same data, because the snapshot list was 98% of it. On a platform, the ratio between the two measurements is the fraction of catalog traffic that is history being re-sent, and it is usually the largest single lever on catalog cost.
Final thoughts
The manifests took care of themselves, and the operation for fixing them did nothing measurable. The metadata file did not take care of itself. It grew by a kilobyte a commit, was copied in full on every one, and was served in full to every engine that loaded the table. The retention that would have bounded the copies was off, and once on it could not reach what had already been lost. The statistics were correct to a percent and were read by one engine — and ignored by the one that wrote them.
None of that is visible from a query’s latency — which is why this chapter counted requests and bytes instead. The next chapter is the policy that keeps the metadata file small, which is retention. How long to keep a snapshot, on which branch, for whom, and how to prove the holds survive the expiry that removes everything else.
Comments