Logs, Metrics, and Traces: Picking the Signal That Answers the Question
The three telemetry signals and what the standard library gives you — slog for logs, expvar publishing counters as JSON at /debug/vars for metrics (run and verified), and OpenTelemetry for traces (described honestly, flagged as not stood up here). Compiled and run against Go 1.26.5.
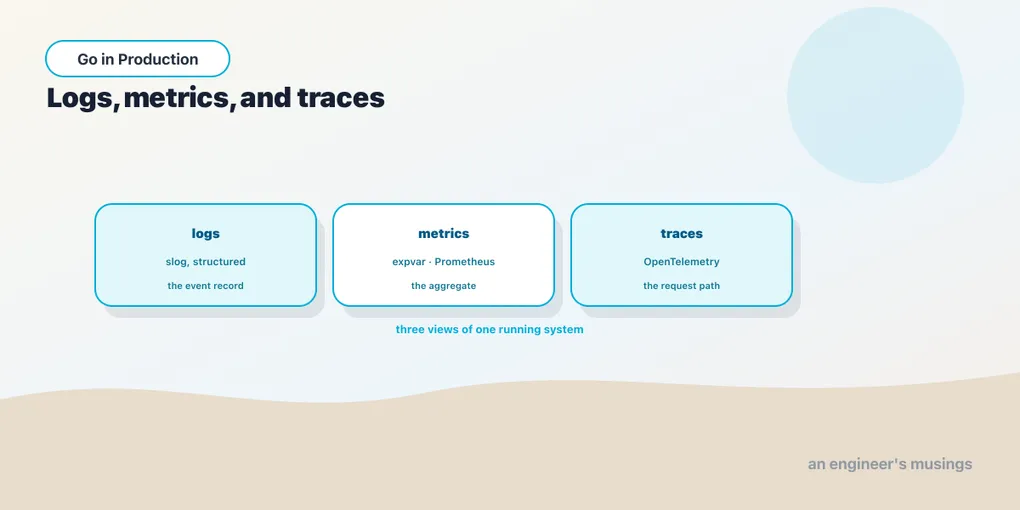
Once a service takes real traffic, the question stops being “does it work?” and becomes “what is it doing right now, and why did that one request take four seconds?” Answering that is observability, and it comes in three flavors, usually called the three pillars: logs, metrics, and traces. They are not interchangeable, and the most common observability mistake is reaching for the wrong one — grepping gigabytes of logs to compute a number a metric would have given you for free, or staring at an aggregate graph when what you needed was the story of a single request. This chapter is about which signal answers which question, and what Go’s standard library hands you for each.
Run against: Go 1.26.5, for everything runnable here; the one thing that needs external infrastructure is flagged as not stood up.
Three signals, three questions
The signals map cleanly onto three different questions, and picking correctly is most of the skill:
- Logs answer “what happened, in order?” — discrete events with detail. One request failed; here is the error, the request id, the timestamp. Logs are the narrative. They are precise and high-cardinality and expensive at volume, so they’re for events you’ll want to read individually.
- Metrics answer “how much, how many, how fast — in aggregate?” — numbers you can add up, average, and graph over time. Requests per second, error rate, p99 latency, memory in use. A metric is cheap because it throws away the individual events and keeps only the running number, which is exactly why you can’t use it to explain one specific request.
- Traces answer “where did this one request spend its time?” — the path of a single request as it fans out across functions and services, with a timing on each hop. When a request touches five services and one of them is slow, a trace is the only signal that shows you which.
The failure mode to avoid: don’t compute aggregates from logs (that’s a metric’s job, and it’s slow and costly), and don’t try to debug one request from a graph (that’s a trace’s job). Match the signal to the shape of the question.
Logs: you already have slog
Logs are the signal Go gives you most completely, and we covered it in chapter 2: log/slog, the standard library’s structured logger. Structured is the operative word. A line like slog.Info("request handled", "path", r.URL.Path, "status", 200, "ms", 4) emits key-value pairs a log system can index and query, rather than a prose sentence you can only grep. That is the whole reason to prefer it over log.Printf in production: level=INFO msg="request handled" path=/books status=200 ms=4 is a record, not a string. Because slog is thoroughly covered already, this chapter spends its runnable budget on the pillar most people don’t realize is in the standard library too: metrics.
Metrics: expvar publishes counters as JSON
The expvar package is the standard library’s quietly-forgotten metrics facility. Importing it registers an HTTP handler at /debug/vars that serves every published variable as a single JSON document. You publish a counter with expvar.NewInt, increment it with .Add, and it appears in that document automatically — no scrape library, no dependency:
var (
	requests = expvar.NewInt("bookshop_requests_total")
	errors   = expvar.NewInt("bookshop_errors_total")
)

func main() {
	http.HandleFunc("/books", func(w http.ResponseWriter, r *http.Request) {
		requests.Add(1)
		fmt.Fprintln(w, "ok")
	})
	go http.ListenAndServe("localhost:7070", nil)
	// ...
}
Drive three requests through /books, record one error, then fetch /debug/vars the way a scraper would. The two custom counters come back exactly as published:
"bookshop_requests_total": 3
"bookshop_errors_total": 1
And the full document shows the shape — your vars alongside two that expvar publishes for free, cmdline and memstats:
{
"bookshop_errors_total": 1,
"bookshop_requests_total": 3,
"cmdline": ["/var/folders/.../c4-06-expvar"],
"memstats": {"Alloc":440856,"TotalAlloc":440856,"Sys":8...
That memstats object is the entire runtime.MemStats struct — heap size, GC pause history, allocation counts — exposed as metrics with zero effort on your part. For a small service, or for a quick internal dashboard, expvar is genuinely enough: a counter, a JSON endpoint, and something that polls it.
Where it stops is the ecosystem. expvar speaks its own JSON, and the de-facto standard for metrics is Prometheus, which scrapes a different text format and expects histograms, labels, and typed metrics that expvar doesn’t model. So in most production Go services the metrics library is client_golang, Prometheus’s official client. It gives you counters, gauges, histograms, and summaries with labels, and exposes them at /metrics in the format Prometheus scrapes. It is a third-party dependency, and it is the one nearly everyone reaches for — but knowing expvar exists is worth it, because for a lot of internal tooling you don’t need more than the standard library already ships.
Traces: OpenTelemetry, described honestly
Tracing is the signal the standard library does not give you, and it’s the one that needs the most infrastructure, so here I’m going to be precise about what I did and didn’t run.
A trace follows one request end to end. Each unit of work — an incoming HTTP handler, an outbound call to another service, a database query — becomes a span with a start time, a duration, and a parent. The spans share a trace id, and each carries the id of its parent span, so a collector can reassemble them into a tree that shows exactly where a single request spent its time and which downstream call was the slow one. The magic that makes it work across process boundaries is context propagation: the trace id travels in HTTP headers (the W3C traceparent header is the standard), so when service A calls service B, B’s spans attach to A’s trace instead of starting a new one. That is how you get a single timeline for a request that touched five services.
The standard for all of this in Go is OpenTelemetry (OTel) — a vendor-neutral set of libraries (go.opentelemetry.io/otel) for creating spans and an exporter that ships them to a collector, which forwards them to a backend like Jaeger, Tempo, or a hosted vendor. You instrument your code with tracer.Start(ctx, "span-name"), thread the returned context through your calls, and the SDK batches and exports the spans in the background.
Not run. None of the tracing in this section was executed — I did not stand OpenTelemetry up.
It needs a running collector and a trace backend to send spans to, and this environment has no external infrastructure. So unlike the
expvarsection above, this is described rather than measured, and I would rather say so than paste output I cannot produce. What is above is the accurate mental model — spans, a shared trace id, context propagation over headers, an SDK that exports to a collector — and it is enough to know what tracing is for and when to reach for it. Standing up OTel with a Jaeger backend is a chapter of its own, on infrastructure that can actually run the collector.
Putting it together
The three signals are complementary, and a mature service emits all three. A single request might: increment a requests_total metric (so the aggregate rate is graphable), emit a structured log line with its request id and outcome (so you can find that exact request later), and produce a trace (so if it was slow, you can see which downstream call ate the time). The request id is the thread that stitches them together — put it on the log line and the span, and you can pivot from “the error rate metric spiked at 3pm” to “here are the logs” to “here is the trace of one slow request” without losing your place.
When you’re deciding which to add, go back to the question you’re trying to answer. Need to know how often something happens? Metric. Need the details of a specific occurrence? Log. Need to know where the time went on a request that crossed services? Trace. Adding the wrong one is how you end up paying to store logs you only use to count, or how you end up unable to explain a latency spike because all you kept was the average.
Final thoughts
Observability is three questions wearing three signals. Logs are events in order, and Go hands you a first-class structured logger in slog. Metrics are aggregates, and the standard library’s expvar will publish counters as JSON at /debug/vars today — verified above, three requests and one error showing up exactly as published — with Prometheus’s client_golang as the step up when you outgrow it. Traces are the path of one request across services, and for those you reach outside the standard library to OpenTelemetry, which needs a collector. Pick the signal that fits the question, thread a request id through all three, and the next time production misbehaves you’ll be reading the answer instead of guessing at it.
Next: one command, every platform — building and releasing the binary, cross-compilation, and stamping version information in at build time.
Comments