The Goroutine That Never Returns
A goroutine blocked forever on a send or receive that will never complete never returns, leaking its stack and everything it captured — and the race detector will not catch it. Proving leaks with runtime.NumGoroutine, and fixing them with a context escape or a buffer sized so the sender never blocks. Compiled and run under the race detector against Go 1.26.5.
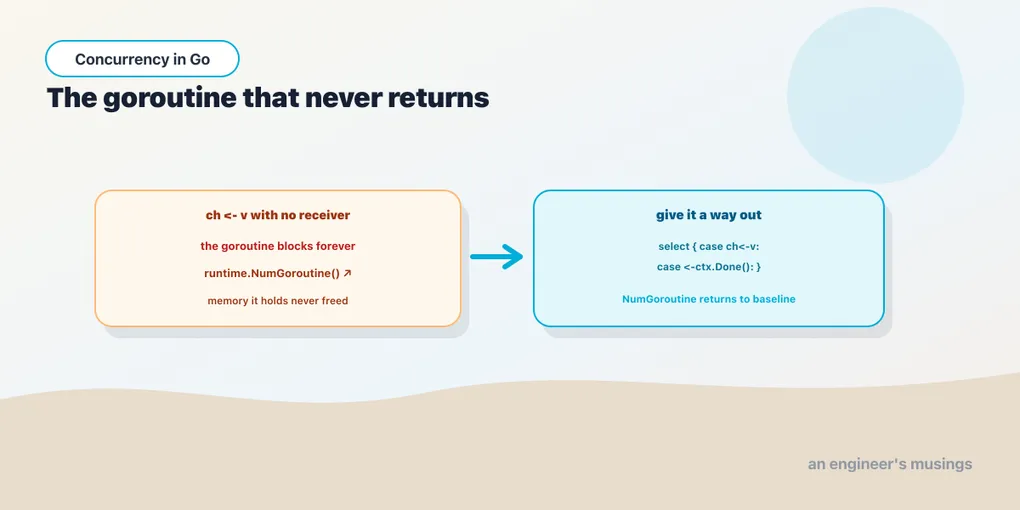
A goroutine ends exactly one way: its function returns. There is no external kill switch, no goroutine.Stop(), no way for one goroutine to terminate another. So a goroutine that blocks on an operation that will never complete, a receive from a channel nobody will send to, a send to a channel nobody will receive from, simply never returns. It sits there, parked, holding its entire stack and every variable it closed over, for the life of the process. That is a goroutine leak, and it is the quiet, cumulative memory bug of concurrent Go.
It is quiet because nothing complains. A leaked goroutine throws no error and logs nothing. The program keeps running, a little heavier each time, until a long-lived service that leaks one goroutine per request has hundreds of thousands of them and an ever-climbing memory graph that nobody can explain. And the tool you would hope catches it does not.
The race detector does not catch this
Worth stating plainly, because it is a common and costly misconception. The race detector, which you have been running with -race all series, finds data races: two goroutines touching the same memory without synchronization. A leak is not a data race. A goroutine blocked forever on a channel is perfectly synchronized; it is just blocked. There is no conflicting access to detect, so -race sees nothing wrong. Here is a program that leaks five goroutines, run clean under the detector:
func main() {
	fmt.Println("baseline:", runtime.NumGoroutine())

	ch := make(chan int) // nobody will ever send on this
	for i := 0; i < 5; i++ {
		go func() {
			<-ch // blocks forever: this goroutine never returns
		}()
	}

	time.Sleep(50 * time.Millisecond) // let all five reach the blocked receive
	fmt.Println("after spawning 5 blockers:", runtime.NumGoroutine())
}
baseline: 1
after spawning 5 blockers: 6Under go run -race the output is identical, with no race reported. The leak is real and the detector is silent. So you need a different instrument.
Proving a leak with NumGoroutine
That instrument is runtime.NumGoroutine(), which returns the number of goroutines currently alive. It is the direct way to see a leak instead of inferring it from a memory graph. The technique in the program above is the one to remember: measure a baseline, do the thing, measure again. Baseline is 1, just main. After spawning five goroutines that each block on <-ch, the count is 6 and stays there. Those five are never coming back, because nothing will ever send on ch and a bare <-ch has no other way to proceed. The count that should have returned to 1 is stuck at 6, and that stuck number is the leak made visible.
This before/after check is not just a teaching device. Wrapping a test in a NumGoroutine assertion, snapshot the count at the start, run the code, force a garbage collection and a brief pause, assert the count came back, is a genuine way to catch leaks in CI, and it is roughly what leak-detector libraries do under the hood.
Fix one: an escape hatch with context
The blocked goroutines leak because a bare <-ch has exactly one way forward and it never comes. Give the goroutine a second way to proceed and it can always return. That second way is the select statement racing the real operation against a cancellation signal, here a context (from the context chapter):
func main() {
	fmt.Println("baseline:", runtime.NumGoroutine())

	ctx, cancel := context.WithCancel(context.Background())
	ch := make(chan int) // still nobody sends

	for i := 0; i < 5; i++ {
		go func() {
			select {
			case <-ch: // the value that never comes
			case <-ctx.Done(): // the escape hatch
			}
		}()
	}

	time.Sleep(50 * time.Millisecond)
	fmt.Println("with 5 blocked workers:", runtime.NumGoroutine())

	cancel() // tell every worker to give up
	time.Sleep(50 * time.Millisecond)
	fmt.Println("after cancel:", runtime.NumGoroutine())
}
baseline: 1
with 5 blocked workers: 6
after cancel: 1Follow the three numbers. Baseline 1. After launching five goroutines each blocked in their select, the count is 6, exactly the leak from before. Then cancel() closes the context’s Done channel, every goroutine’s <-ctx.Done() case becomes ready, each select fires it and the goroutine returns, and the count drops back to 1. The leak is gone.
One honest detail about how that last number was read. cancel() returns immediately; the goroutines take a moment to wake, run their select, and exit. The time.Sleep(50 * time.Millisecond) after cancel() is there to give them that moment before NumGoroutine is sampled, and the reliable 1 in the output is the evidence they all unwound. In production you would not sleep, you would wait on a WaitGroup; the sleep here is a measurement aid so the printed count is meaningful.
Fix two: a buffer so the sender never blocks
Not every leak is a stuck receiver. The most common real-world leak is a stuck sender: a goroutine computes a result, tries to send it, and the consumer already moved on and stopped receiving. This is the abandoned-receiver bug, and it bites the “launch several workers, take the first answer” pattern in particular:
// firstResult launches three workers that each send one answer, then takes only
// the first and returns. Whether the other two leak depends on the channel.
func firstResult(buffered bool) int {
	var ch chan int
	if buffered {
		ch = make(chan int, 3) // room for every sender, so none ever blocks
	} else {
		ch = make(chan int) // unbuffered: a sender blocks until someone receives
	}
	for i := 1; i <= 3; i++ {
		go func(n int) {
			ch <- n * n // the send that may never be received
		}(i)
	}
	return <-ch // take ONE answer and walk away from the other two
}
The function launches three senders but receives exactly once, then returns. What happens to the two senders whose value nobody reads depends entirely on the channel’s buffer:
func main() {
	fmt.Println("baseline:", runtime.NumGoroutine())

	_ = firstResult(true) // buffered: the two unread senders still complete
	time.Sleep(50 * time.Millisecond)
	fmt.Println("after buffered call:", runtime.NumGoroutine())

	_ = firstResult(false) // unbuffered: the two unread senders block forever
	time.Sleep(50 * time.Millisecond)
	fmt.Println("after unbuffered call:", runtime.NumGoroutine())
}
baseline: 1
after buffered call: 1
after unbuffered call: 3The buffered call leaks nothing: with a buffer of 3, all three sends complete into the buffer immediately whether or not anyone reads, so all three goroutines return, and the count is back to 1. The unbuffered call leaks two: an unbuffered send blocks until a receiver takes the value, only one receiver ever shows up, and the other two goroutines are parked on ch <- ... forever, leaving the count at 3. Sizing the buffer to the number of sends means no sender ever has to wait for a receiver that may not come.
Finding leaks in a running service
NumGoroutine gives you a single number, which is enough to detect a leak but not to locate one. When a real service’s goroutine count is climbing and you need to know which goroutines and where they are stuck, the tool is the runtime’s goroutine profile, exposed through net/http/pprof. Import it for its side effect (import _ "net/http/pprof"), and a debug endpoint will dump a stack trace for every live goroutine, grouped and counted. A leak shows up as thousands of goroutines all parked on the same line, a chan receive or chan send at the exact spot in your code where the escape hatch is missing. The count tells you that you leak; the profile tells you where. On a service that has been up for a while, that grouped stack dump is usually the fastest path from “memory is climbing” to the specific unbuffered send or hatch-less receive at fault.
Which fix you want depends on the shape of the leak. Use a context or done-channel when a goroutine is waiting on something that might not happen and you need a way to tell it to give up (the escape-hatch case). Use a buffered channel when a goroutine is trying to hand off a result and the receiver might already be gone (the abandoned-sender case). Both come down to the same principle: never let a goroutine’s only path forward be an operation that some other goroutine can silently decide never to complete.
Final thoughts
A goroutine leaks when it blocks forever on a channel operation that will never complete, because the only way a goroutine ends is by returning. It costs you its stack and everything it captured, it accumulates silently over the life of a process, and the race detector will not warn you, because a leak is not a data race. The instrument that does see it is runtime.NumGoroutine: measure a baseline, run the code, measure again, and a count that fails to come back down is the leak. The fixes are two shapes of the same idea, a select with a <-ctx.Done() escape for a goroutine waiting on something that may never arrive, or a buffer sized so a sender never blocks on an absent receiver. Every goroutine you start is a promise that it will eventually return; leaks are the promises you forgot to keep.
Next: errgroup: structured concurrency — running a group of goroutines that can fail, cancel each other, and report the first error, without hand-rolling any of this.
Comments