Observability at Scale: Seeing What Claude Is Doing
Why a production Claude system is harder to observe than an ordinary service — non-determinism, per-call cost, silent quality regressions, RAG retrieval quality — and the four-layer answer: structured logging, tracing the multi-step path, metrics for latency and cost and errors, and monitoring for drift, with the usage object as your cost-and-latency meter.
You cannot operate what you cannot see. The security chapter scoped down what the support platform is allowed to do. This one is about watching what it actually does in production, which is genuinely harder than watching an ordinary web service. Getting it wrong doesn’t crash the system. It does something worse: it lets the system quietly get less useful while every dashboard stays green. This chapter is about building the instrumentation that catches that before your customers do.
Why LLM systems are harder to observe
A traditional service is mostly deterministic and cheap per request, so its observability story is mature. Same input, same output. A request either errors or it doesn’t, and latency and error rate tell you most of what you need. A Claude system breaks all three of those assumptions, and each break is a reason the usual monitoring misses things.
- Non-determinism. The same prompt can produce different outputs on different calls. A green “200 OK” tells you the request completed, not that the answer was any good. Correctness is no longer implied by success. A system can be failing at its actual job, giving wrong or unhelpful answers, while every HTTP-level signal looks perfect.
- Cost per call. Each request spends real money, set by tokens in and out, and the amount varies with the input. An ordinary service’s per-request compute cost is a rounding error you never watch. Here it’s a first-class metric that can 10× on a bad prompt change or a runaway agent loop. If you’re not watching it, the first sign is the invoice.
- Silent quality regression. This is the one that hurts. A model swap, a prompt edit, a corpus update, or upstream drift can make answers worse with no error at all. No exception, no failed status, nothing for a traditional alert to fire on. Quality degrades under a flat error-rate graph. Without a signal aimed specifically at answer quality, you find out from a rise in complaints or a fall in resolution rate, weeks late.
- RAG retrieval quality. In a RAG system the answer is only as good as the chunks retrieved, and retrieval can rot independently of everything else. An index goes stale, a corpus change shifts what surfaces, embeddings drift. The generation step looks healthy while it’s being fed the wrong context. You have to observe retrieval as its own stage, not fold it invisibly into “the assistant answered.”
The through-line: success and quality are different things here, and only the first one is visible for free. Everything below exists to make the second one visible too.
The four layers
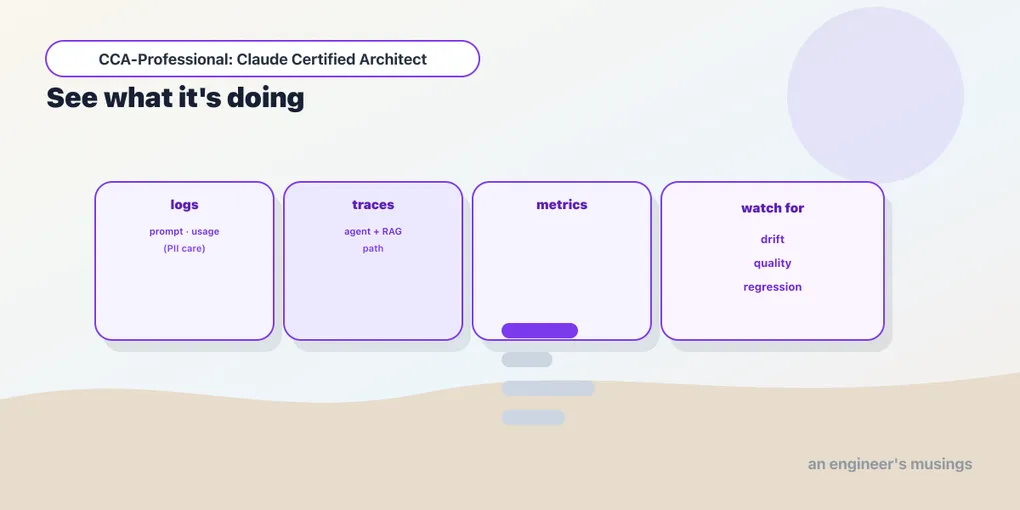
Observability for this platform is four kinds of signal, each answering a different question.
Logging — what happened on this one call. For every request, capture a structured record: a request id, the session and feature, the model, the prompt (or a reference to it), the response, the stop_reason, and the token counts. Structured, not free-text. You will query these by feature and by user, and grep doesn’t scale. Two disciplines matter. First, log with PII care. The security and GDPR posture doesn’t stop at the tool layer. Prompts and responses that carry customer data must be redacted, tokenized, or access-controlled in the log store exactly as they are everywhere else. A logging pipeline is a data-processing path, and a classic place PII leaks. Second, log enough to reconstruct a bad answer: the retrieved chunks, the tool calls and their results, the final generation. When a customer reports a wrong answer, the log is your only way back to what the model actually saw.
Tracing — the path through a multi-step request. A single support answer is rarely one model call. It’s a retrieval, maybe a tool call to look up an order, maybe a subagent handoff, then a generation. A trace stitches those steps into one timeline under a shared id so you can see the whole path and where the time and the failure went. Without tracing, a slow or wrong answer is a mystery. You know the request took four seconds, but not that 3.5 of them were a slow retrieval, or that the model answered fine but off the wrong chunk. Tracing is what turns “the assistant is slow sometimes” into “retrieval p95 blew out after the reindex.”
Metrics — the aggregate health numbers. Roll the per-call data up into time series you can graph and alert on: latency (percentiles, not averages; the mean hides the tail that violates your SLA), cost (spend per feature and per day), error rate (API errors, tool failures, and refusals), and token usage (input and output volume, the thing that drives cost). These are the vital signs. Their value is that they make a change visible: a latency percentile creeping up, a cost-per-request step change after a deploy, an error rate spiking on one tool.
Drift and quality monitoring — is it still good. The layer traditional monitoring doesn’t have, and the one that catches the silent regression. Because quality isn’t in the error rate, you instrument proxies for it and watch them over time. Resolution or deflection rate, escalation-to-human rate, thumbs-up/down or CSAT, and a sampled LLM-as-judge score run over a slice of production traffic. The point isn’t any single number — it’s the trend. A quiet slide in resolution rate or a rise in escalations is the shape a silent regression makes, and this layer is how you see it while it’s still small.
The usage object is your cost-and-latency meter
The cost and token metrics don’t need a third-party tool to source. They’re already in every response. As Foundations covered in cost and caching, the usage object on each response carries input_tokens, output_tokens, and the cache-accounting fields. Output tokens bill several times higher than input. That object is your cost telemetry; you never have to estimate spend after the fact. The operational discipline: capture it on every call, alongside the wall-clock latency you time yourself, and ship both into your metrics:
import time, json, logging

logger = logging.getLogger("bookshop.claude")

def call_and_log(client, *, feature, session_id, **kwargs):
    start = time.monotonic()
    response = client.messages.create(**kwargs)
    latency_ms = (time.monotonic() - start) * 1000

    u = response.usage
    logger.info(json.dumps({
        "feature": feature,
        "session_id": session_id,
        "model": response.model,
        "stop_reason": response.stop_reason,
        "latency_ms": round(latency_ms, 1),
        "input_tokens": u.input_tokens,
        "output_tokens": u.output_tokens,
        "cache_read_input_tokens": getattr(u, "cache_read_input_tokens", 0),
    }))
    return response
Tagging each record with the feature and session_id is what lets you slice spend and latency by product surface later. That’s the difference between “the bill went up” and “the refund flow’s output tokens doubled after Tuesday’s prompt change.” That one wrapper feeds three of the four layers at once. It’s the per-call log, it sources the cost and latency and token metrics, and with a request id added it’s a span in the trace.
What to instrument and alert on
At scale you can’t watch everything, so alert on the signals that mean something is wrong now and dashboard the rest for investigation. The alerts worth paging on map straight onto the platform’s SLAs:
- Latency p95/p99 over the SLA threshold — the tail is what customers feel, and it’s usually retrieval or a slow tool, which the trace will pinpoint.
- Cost per request or daily spend stepping up — a step change almost always traces to a deploy. A prompt that got longer, caching that silently stopped hitting, an agent looping more turns.
- Error and refusal rate spiking, sliced by tool and by feature so the alert points at the culprit rather than just the system.
- A quality proxy trending down — resolution rate, or the sampled judge score, falling over days. This one is a slower alert, a trend not a spike, and it’s the one that catches the silent regression nothing else would.
The dashboard the support team actually watches is those four rolled together: latency and cost against their SLA lines, error rate by tool, and the quality trend with the escalation rate beside it. Read together they answer the operator’s real question. That question is not “is it up” but “is it up, affordable, fast enough, and still good” — four questions, because for a Claude system those genuinely are four different things.
What the exam is really testing
The observability items reward one recognition: an LLM system can fail without erroring, so observability that only watches errors and uptime is blind to its most important failure. When a scenario describes answers quietly getting worse, or a cost surprise, or a slow-answer mystery, reach for the layer aimed at that failure. A quality/drift signal for the silent regression, the usage object and cost metrics for spend, a trace for the multi-step latency. The trap answer is the traditional-monitoring reflex: “watch the error rate and uptime,” which would show green through every one of those.
Build the four layers, source cost and latency straight from usage, guard the logs for PII as carefully as the tools, and alert on the SLAs plus a quality trend. Then when the system degrades — and a non-deterministic system will — you see it in the instrumentation instead of in the complaints.
Next: evaluation metrics and datasets — turning “is it still good” from a monitored trend into a measured score, with the metrics and golden datasets that make quality a number you can test.
Comments